
MYERS INDUSTRIES INC's Return to Profit: Growth Catalysts and Capital Strategy in Review
MYERS Industries posted a notable profit recovery in 2025 driven by margin expansion and strategic acquisition, despite revenue softness and leverage concerns.
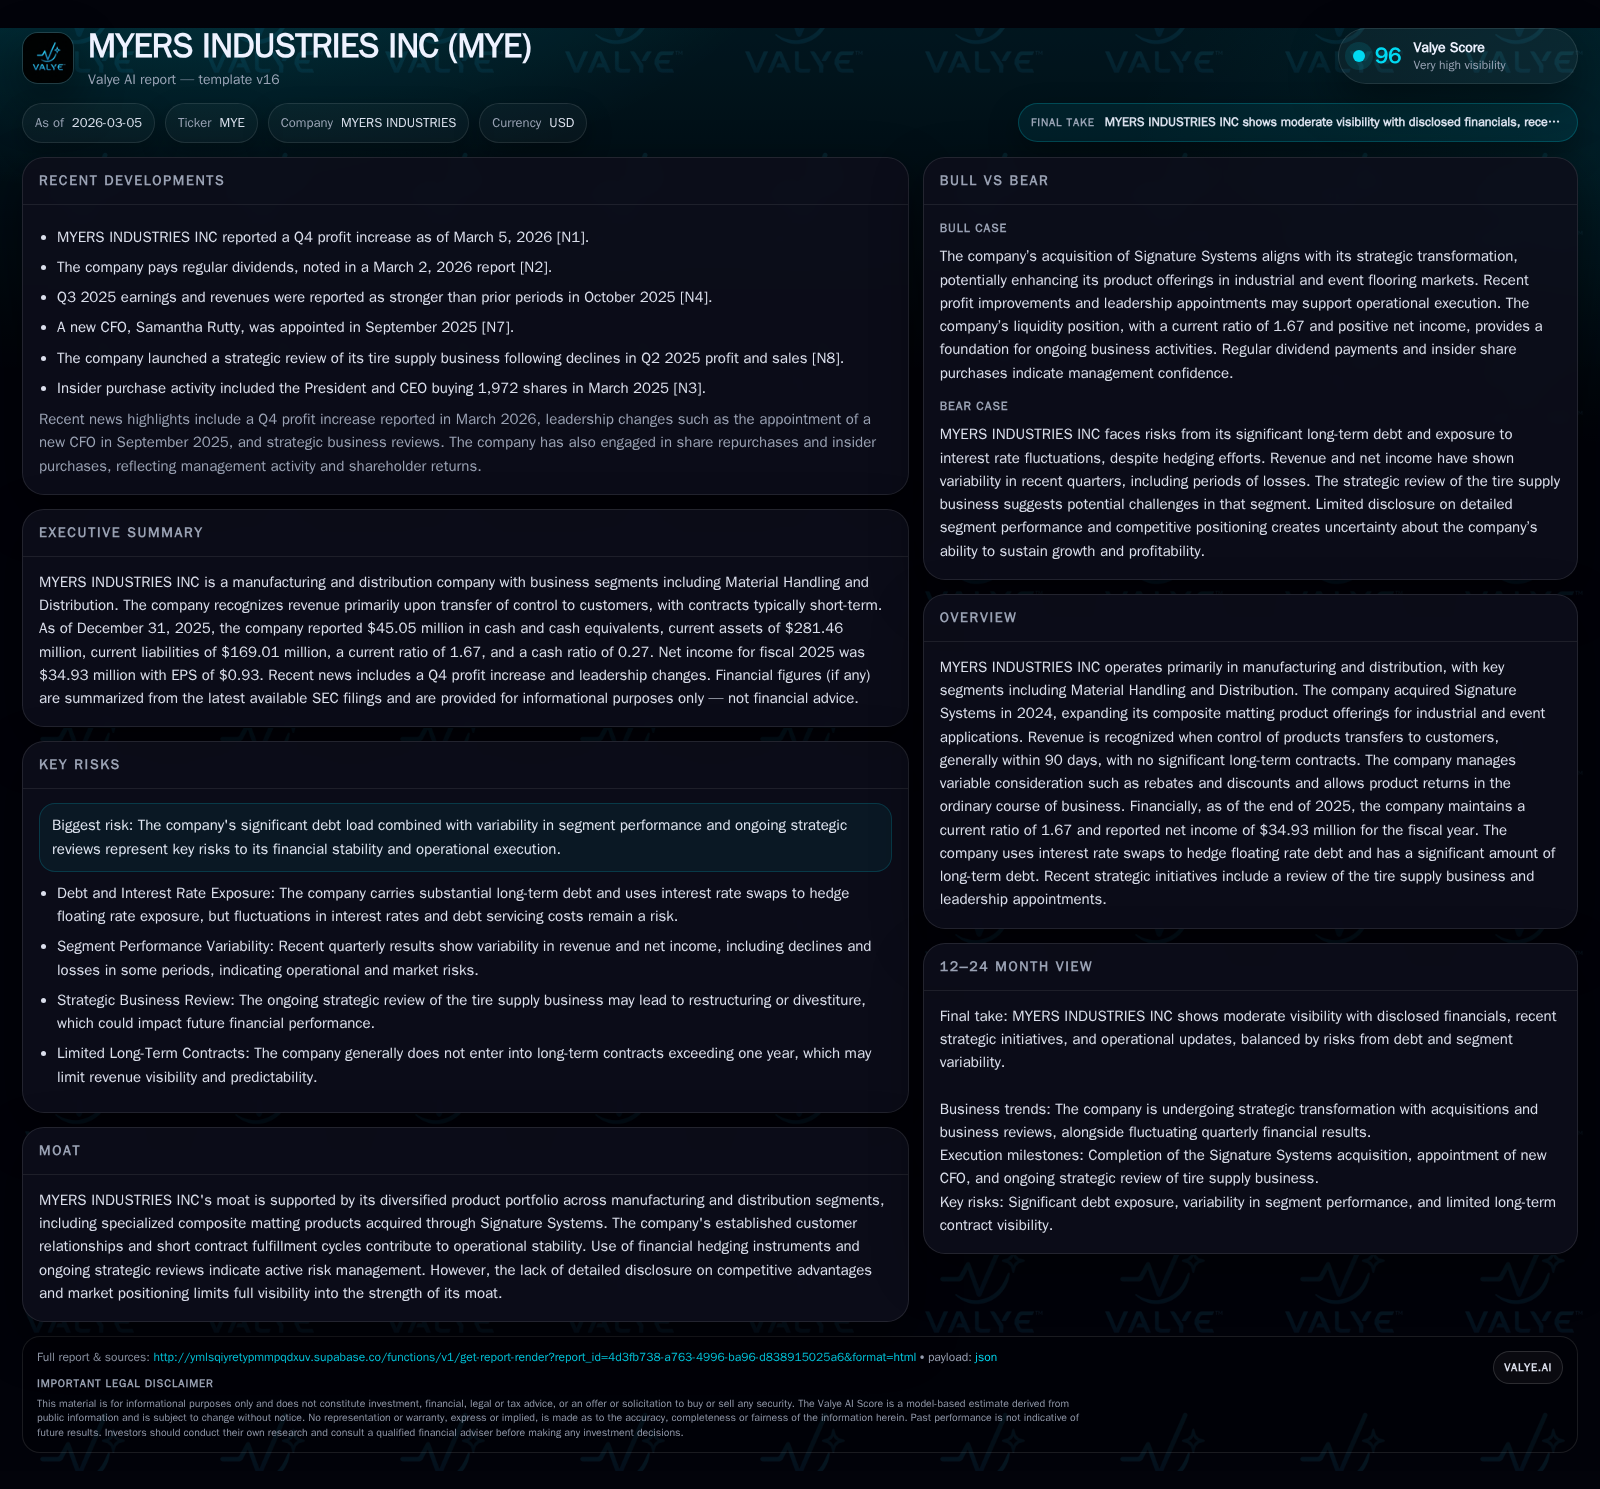
MYERS INDUSTRIES INC demonstrated a sharp rebound in net income for fiscal 2025, with profitability surging over 385% year-over-year while revenue declined roughly 12.6%. Key drivers included operational efficiency gains, cost controls, and contribution from the Signature Systems acquisition in its composite matting products segment. The company manages leverage actively via interest rate swaps amidst significant long-term debt and maintains a solid current ratio of 1.67. Shareholder returns remain stable through sustained dividends, though buybacks are modest relative to historical levels. Looking ahead, uncertainty around segment variability and strategic reviews including the tire supply business pose risks to margin sustainability.
Rebound Profile: FY2025 Financial Highlights and YoY Comparisons
MYERS INDUSTRIES INC’s fiscal year 2025 marked a dramatic financial turnaround from the prior year’s earnings challenge. Revenues retrenched by approximately 12.6% year-over-year to $141.7 million, reflecting top-line pressures possibly linked to market demand variability or pricing dynamics [F1]. However, the more striking narrative is found in the income statement’s profitability lines: operating income soared by 67.6%, climbing to $74.6 million, while net income exploded nearly fourfold to $34.9 million from just $7.2 million in FY2024 [F1]. This rebound sets a compelling backdrop for understanding the underlying operational shifts and structural changes driving MYE’s improved margin profile despite softer sales.
Key Operational Drivers Behind Profitability Recovery
Margin expansion was realized against revenue contraction through several intertwined factors highlighted in MD&A disclosures and recent earnings commentary [N1][S1][S2]. The company emphasizes tight cost management measures—reflected in disciplined SG&A spending—and transformation initiatives begun post-acquisition that elevated the share of higher-margin product lines within its segments.
Operational mix changed favorably as composite matting solutions gained traction following the Signature Systems acquisition (discussed below), partially offsetting declines elsewhere. Moreover, control over variable considerations such as rebates and product returns remains integral, given MYERS’ recognition of revenues upon product control transfer typically within short cycles (~90 days) without long-term contracts [S13][S17], allowing nimble adjustments to inventory and working capital.
Impact of Signature Systems Acquisition on Product Mix and Segment Performance
The February 8, 2024 purchase of Signature Systems was a pivotal step aligning with MYERS’ strategy to transform into a high-growth innovator specializing in engineered plastic solutions [S11][N1]. Signature notably broadened the composite matting offerings utilized across industrial applications, event flooring, and stadium turf protection—a niche demanding durable yet lightweight materials.
This acquisition enhanced the Material Handling segment’s product portfolio, not only diversifying revenue streams but also contributing incremental operating leverage due to relatively stable demand profiles tied to infrastructure maintenance and event logistics sectors [S11]. Although exact segment-level contributions are cautiously disclosed, Signature’s integration apparently aided operational stability through product innovation synergy and cross-selling opportunities.
Structural Dynamics: Revenue Contraction Versus Operating Income Upswing
The juxtaposition between declining revenue yet surging operating income calls attention to MYERS’ pricing power and cost discipline amid competitive pressures [F1][S2]. Management's ability to optimize variable consideration impacts—such as rebates adjustment—and limit exposure to customer returns has factored into cleaner revenue recognition timelines and lower costs associated with freight and distribution logistics.
Additionally, short contract fulfillment cycles characteristic of manufacturing and distribution operations facilitate quicker inventory turns and minimize deferred revenue risks [S13], allowing better absorption of fixed costs even when topline softens.
Capital Structure Review: Leverage, Interest Rate Hedging, and Liquidity Position
MYERS Industries carries a heavy long-term debt burden prominently featuring a Term Loan A facility originated February 2024 at $400 million initial notional value [S6][S4]. To mitigate interest rate sensitivity on floating-rate components, the company employs interest rate swaps limiting volatility by effectively fixing rates around mid-4% plus margins through January 2029 [S6]. At September 30, 2025, swap notional stood at $185 million with unrealized losses recorded in Other Liabilities totaling roughly $6 million—a typical mark-to-market reflection under hedge accounting standards.
Liquidity ratios affirm sound short-term financial health: as of December-end 2025, current assets totaled $281 million against current liabilities near $169 million delivering a current ratio of approximately 1.67—above conservative thresholds indicative of adequate working capital coverage [F1][S4]. Cash balances stood at roughly $45 million supporting ongoing operations.
Returns to Shareholders: Dividends, Buybacks, and Free Cash Flow Analysis
Despite elevated leverage metrics constraining expansive share repurchase programs seen historically (notably ~$30 million buybacks back in FY2015 versus only $2.5 million in FY2025), MYERS maintained consistent dividend payments just above $20 million annually over recent years including FY2025 [F1][N2]. This underscores a commitment to cash returns albeit balanced carefully against debt service priorities.
Robust free cash flow emerged from operating cash flow generation of approximately $86.8 million minus capital expenditures trimmed by about 20% YoY to $19.6 million for FY2025—yielding an estimated free cash flow near $67.2 million supportive of capital return sustainability even amid ongoing acquisition-related investments [F1].
Near-Term Earnings Outlook and Strategic Priorities to Watch
While explicit management guidance is lacking for forthcoming periods reflecting perhaps strategic recalibration phases, there are key items warranting market attention including ongoing operational reviews such as the tire supply business evaluation which could materially influence segment performance dynamics [N1][S3]. Leadership transitions announced may also introduce executional inflections.
Analytical view suggests monitoring quarterly earnings updates for signals regarding margin pressure continuity or reversal linked to raw material cost trends or demand shifts within industrial end markets served by Distribution and Material Handling arms.
Risks in Focus: Debt Load, Segment Variability, and Ongoing Business Reviews
MYERS Industries delineates considerable risks centered on its pronounced indebtedness combined with exposure to fluctuations across diverse business segments amidst evolving market conditions [S12][S16]. Strategic reviews inherent uncertainties—especially potential disruption during transformation or integration efforts—add complexity.
Investors would be prudent considering these factors within context of capital structure resilience measures such as hedging programs while balancing growth aspirations fueled by acquisitions like Signature Systems.
Historical performance (annual)
| FY | Net ($mm) | CFO ($mm) | OpInc ($mm) | Capex ($mm) | Net YoY |
|---|---|---|---|---|---|
| 2025 | 35 | 87 | 75 | 20 | +385.0% |
| 2024 | 7 | 79 | 44 | 24 | -85.3% |
| 2023 | 49 | 86 | 72 | 23 | -18.9% |
| 2022 | 60 | 73 | 84 | 24 |
Source: SEC companyfacts cache [F1].
Capital returns and efficiency (annual)
| FY | Div ($mm) | FCF ($mm) | ROE% |
|---|---|---|---|
| 2025 | 20 | 67 | 11.9 |
| 2024 | 20 | 55 | 2.6 |
| 2023 | 20 | 63 | 16.7 |
| 2022 | 20 | 48 | 23.5 |
Source: SEC companyfacts cache [F1].
This table succinctly captures MYERS Industries' recent volatility showcasing how profitability metrics recovered robustly despite revenue softness highlighting operational adaptability post-strategic acquisitions like Signature.
Disclaimer:
This analysis is provided for informational purposes only without any investment recommendation or advice. It relies exclusively on publicly available data as cited without predictive forecasts beyond stated management disclosures.
Disclaimer: This is research-only, informational analysis and not investment advice. It may include AI-generated interpretation and general industry context. Always verify important details using primary sources.
Comments