
SB Financial Group’s Multi-Stream Growth and Capital Execution in 2025
SBFG’s 2025 results underscore broad revenue expansion from loans, deposits, and fee services alongside disciplined capital management and robust risk governance.
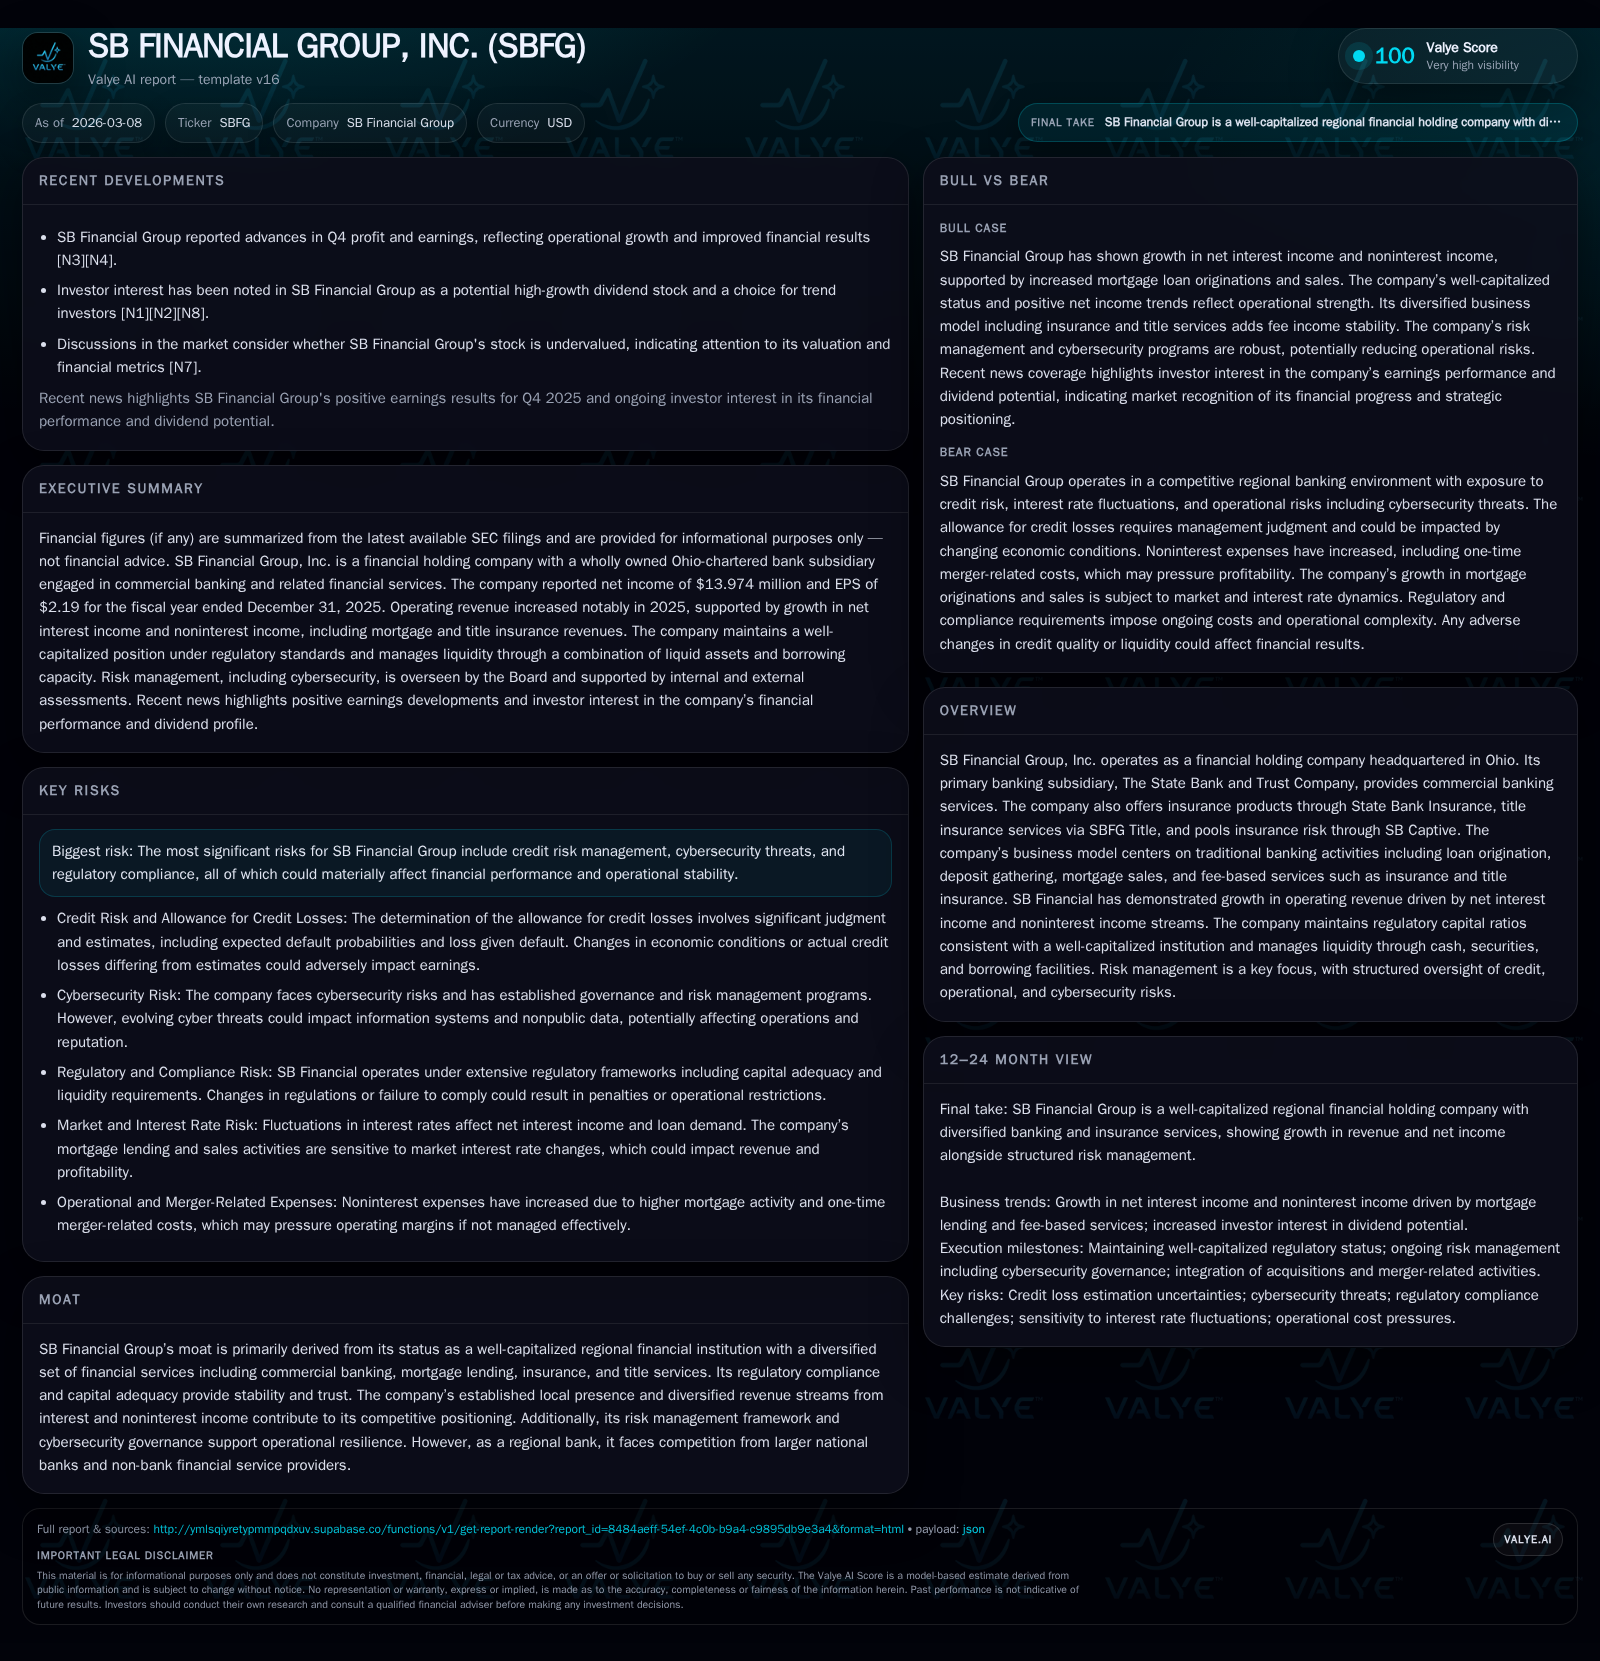
SB Financial Group has evolved beyond traditional regional banking by integrating commercial banking with complementary fee-based businesses such as insurance and title services. In 2025, the company posted a noteworthy 21.8% net income increase, driven by higher net interest income and an expanding noninterest income base. Liquidity and Basel III capital ratios remain solid, reflecting prudent ALCO oversight amid growth. Risk management frameworks have been enhanced with focused cybersecurity governance and credit risk controls. Capital allocation showed steady share buybacks and capex investments aligned with ongoing expansion initiatives.
SB Financial Group, Inc. (SBFG), headquartered in Ohio, has progressed from a conventional commercial bank to a diversified regional financial holding company that integrates commercial lending with specialized fee-generating subsidiaries in insurance sales, title insurance, and captive insurance risk pooling . This transformation equips SBFG with multiple revenue engines supporting both growth and risk mitigation.
Historical Financial Performance Overview
SBFG’s financial trajectory shows modest net income declines of around 3-5% in FY2023 and FY2024 followed by a strong rebound in FY2025 with net income rising 21.8% to $13.97 million [F1]. Operating cash flow exhibited volatility but surged by over 150% in FY2025 to $24 million [F1], signaling improved cash generation efficiency. Capital expenditures more than doubled year-over-year to $2.6 million as operational scaling accelerated.
This performance reflects a combination of net interest margin expansion—driven by an increase in earning assets paired with lower funding costs—and strategic diversification into noninterest income streams including insurance premiums and mortgage-related fees [S12]. The net interest margin grew from approximately 3.08% to 3.44%, underscoring effective asset-liability management.
Historical performance (annual)
| FY | Net ($mm) | CFO ($mm) | Capex ($mm) | Net YoY |
|---|---|---|---|---|
| 2025 | 14 | 24 | 3 | +21.8% |
| 2024 | 11 | 9 | 1 | -5.2% |
| 2023 | 12 | 14 | 1 | -3.4% |
| 2022 | 13 | 26 | 2 |
Source: SEC companyfacts cache [F1].
Capital returns and efficiency (annual)
| FY | Buybacks ($mm) | FCF ($mm) | ROE% |
|---|---|---|---|
| 2025 | 6 | 21 | 9.9 |
| 2024 | 5 | 8 | 9.0 |
| 2023 | 3 | 13 | 9.7 |
| 2022 | 6 | 24 | 10.6 |
Source: SEC companyfacts cache [F1].
Note: Capex % changes are approximate due to rounding [F1].
Revenue Drivers: Loans, Deposits, and Fee-Based Services
Commercial loans form the core asset base with total loans increasing about 6-8% during recent quarters supported by organic growth and the Marblehead acquisition [S7]. The loan portfolio includes commercial real estate, first mortgage residential, agricultural, and multi-family mortgages frequently pledged as collateral for borrowings such as FHLB advances [S4], [S8].
Deposits underpin stable funding sources, growing nearly 10% through transaction and time deposits during the first nine months of fiscal 2025 [S7]. Funding costs declined from about 2.52% to roughly 2.33%, contributing to net interest margin improvement [S12], [S13]. ALCO policies emphasize term matching and repricing alignment to manage deposit attrition risks prudently [S24].
Fee-based revenues complement lending income; mortgage originations rose modestly to $205 million in the first nine months of 2025 compared to $189 million a year earlier, generating gains on sale of approximately $3.7 million versus $3.3 million previously [S12]. Insurance sales via State Bank Insurance and title insurance revenues from SBFG Title increased steadily, with title revenue up by about $0.37 million year-over-year , [S12]. This diversified fee-income mix helps mitigate concentration risks typical of banks reliant mainly on net interest income.
Liquidity and Capital Adequacy
Liquidity remains strong at roughly $285 million comprising cash, due-from-bank balances, federal funds sold, securities available-for-sale, and loans held for sale [S4]. This liquidity is prudently leveraged against pledged loan collateral totaling about $910 million supporting FHLB lien arrangements [S8]. Daily liquidity monitoring by ALCO coupled with board oversight ensures compliance with established policies maintaining adequate operational buffers.
Capital ratios exceed regulatory "well-capitalized" thresholds under Basel III as of September 30, 2025; Tier I Common Equity ratio stands at approximately 12.48%, well above the minimum requirement of 6.5%, while total risk-based capital ratio is near 13.73%, reflecting solid balance sheet strength amidst growth [S20], [F1]. Management excludes unrealized gains/losses on available-for-sale securities from regulatory capital consistent with conservative treatment enhancing stability.
Risk Management Enhancements
Governance of enterprise risks includes Board-level oversight via committees such as the Risk Management Committee focusing on cybersecurity—a critical area given increasing threats faced by financial institutions [S1], [S19]. The Information Security Council implements policies protecting sensitive information with annual internal audits supplemented by external expert assessments.
Cybersecurity leadership features executives with global network operations experience complemented by Harvard-certified expertise emphasizing proactive defense against evolving threats [S1].
Credit risk remains closely managed; provision for credit losses rose moderately to just over $1 million amid portfolio expansion reflecting measured caution [S17]. Nonperforming assets decreased slightly while allowance coverage relative to impaired loans remains robust at over three times nonaccrual balances signaling prudent provisioning.
Capital Allocation Strategy
Capital return initiatives included approximately $5.69 million in share repurchases for FY2025, up from prior years indicating measured shareholder return balanced against reinvestment needs [F1]. Capital expenditures increased significantly to $2.6 million consistent with investments likely related to technology upgrades or branch modernization supporting growth.
Free cash flow (operating cash flow less capex) approximated $21.4 million enabling flexibility for acquisitions, organic expansion funding, and potential shareholder returns while return on equity stood near 9.9%, a solid figure within regional banking balancing risk-return tradeoffs prudently [F1]. Dividend details were not explicitly disclosed but merit monitoring given strong cash generation.
Outlook Considerations
Although no specific forward guidance was issued recently ([N3]), key near-term factors include:
- Integration progress of acquired loan portfolios such as Marblehead impacting scalability and cross-selling opportunities.
- Changes in asset-liability composition amid fluctuating interest rate environments affecting margin dynamics.
- Regulatory developments around Basel III or community bank capital standards potentially influencing future capital deployment.
- Expansion of product offerings including insurance/risk-pooling channels sustaining fee income growth.
- Credit quality trends reflected in charge-offs or provisions providing insight into portfolio health amid economic shifts.[N3], [S23], [S28]
Overall, SB Financial Group’s multi-channel business model combining solid lending fundamentals with diversified fee-based revenues positions it well for sustained profitability growth within its competitive regional niche.
This report synthesizes publicly available SEC filings ([F1],[S#]) and recent news articles ([N#]). It is intended purely for informational purposes without any investment advice or recommendations regarding securities of SB Financial Group, Inc.
Disclaimer: This is research-only, informational analysis and not investment advice. It may include AI-generated interpretation and general industry context. Always verify important details using primary sources.
Comments