
Quanex Building Products' Post-Acquisition Struggles Highlight Operational and Market Pressures
The company’s sharp revenue growth following acquisitions contrasts with substantial operating losses and goodwill impairment, revealing challenges in integration and market dynamics.
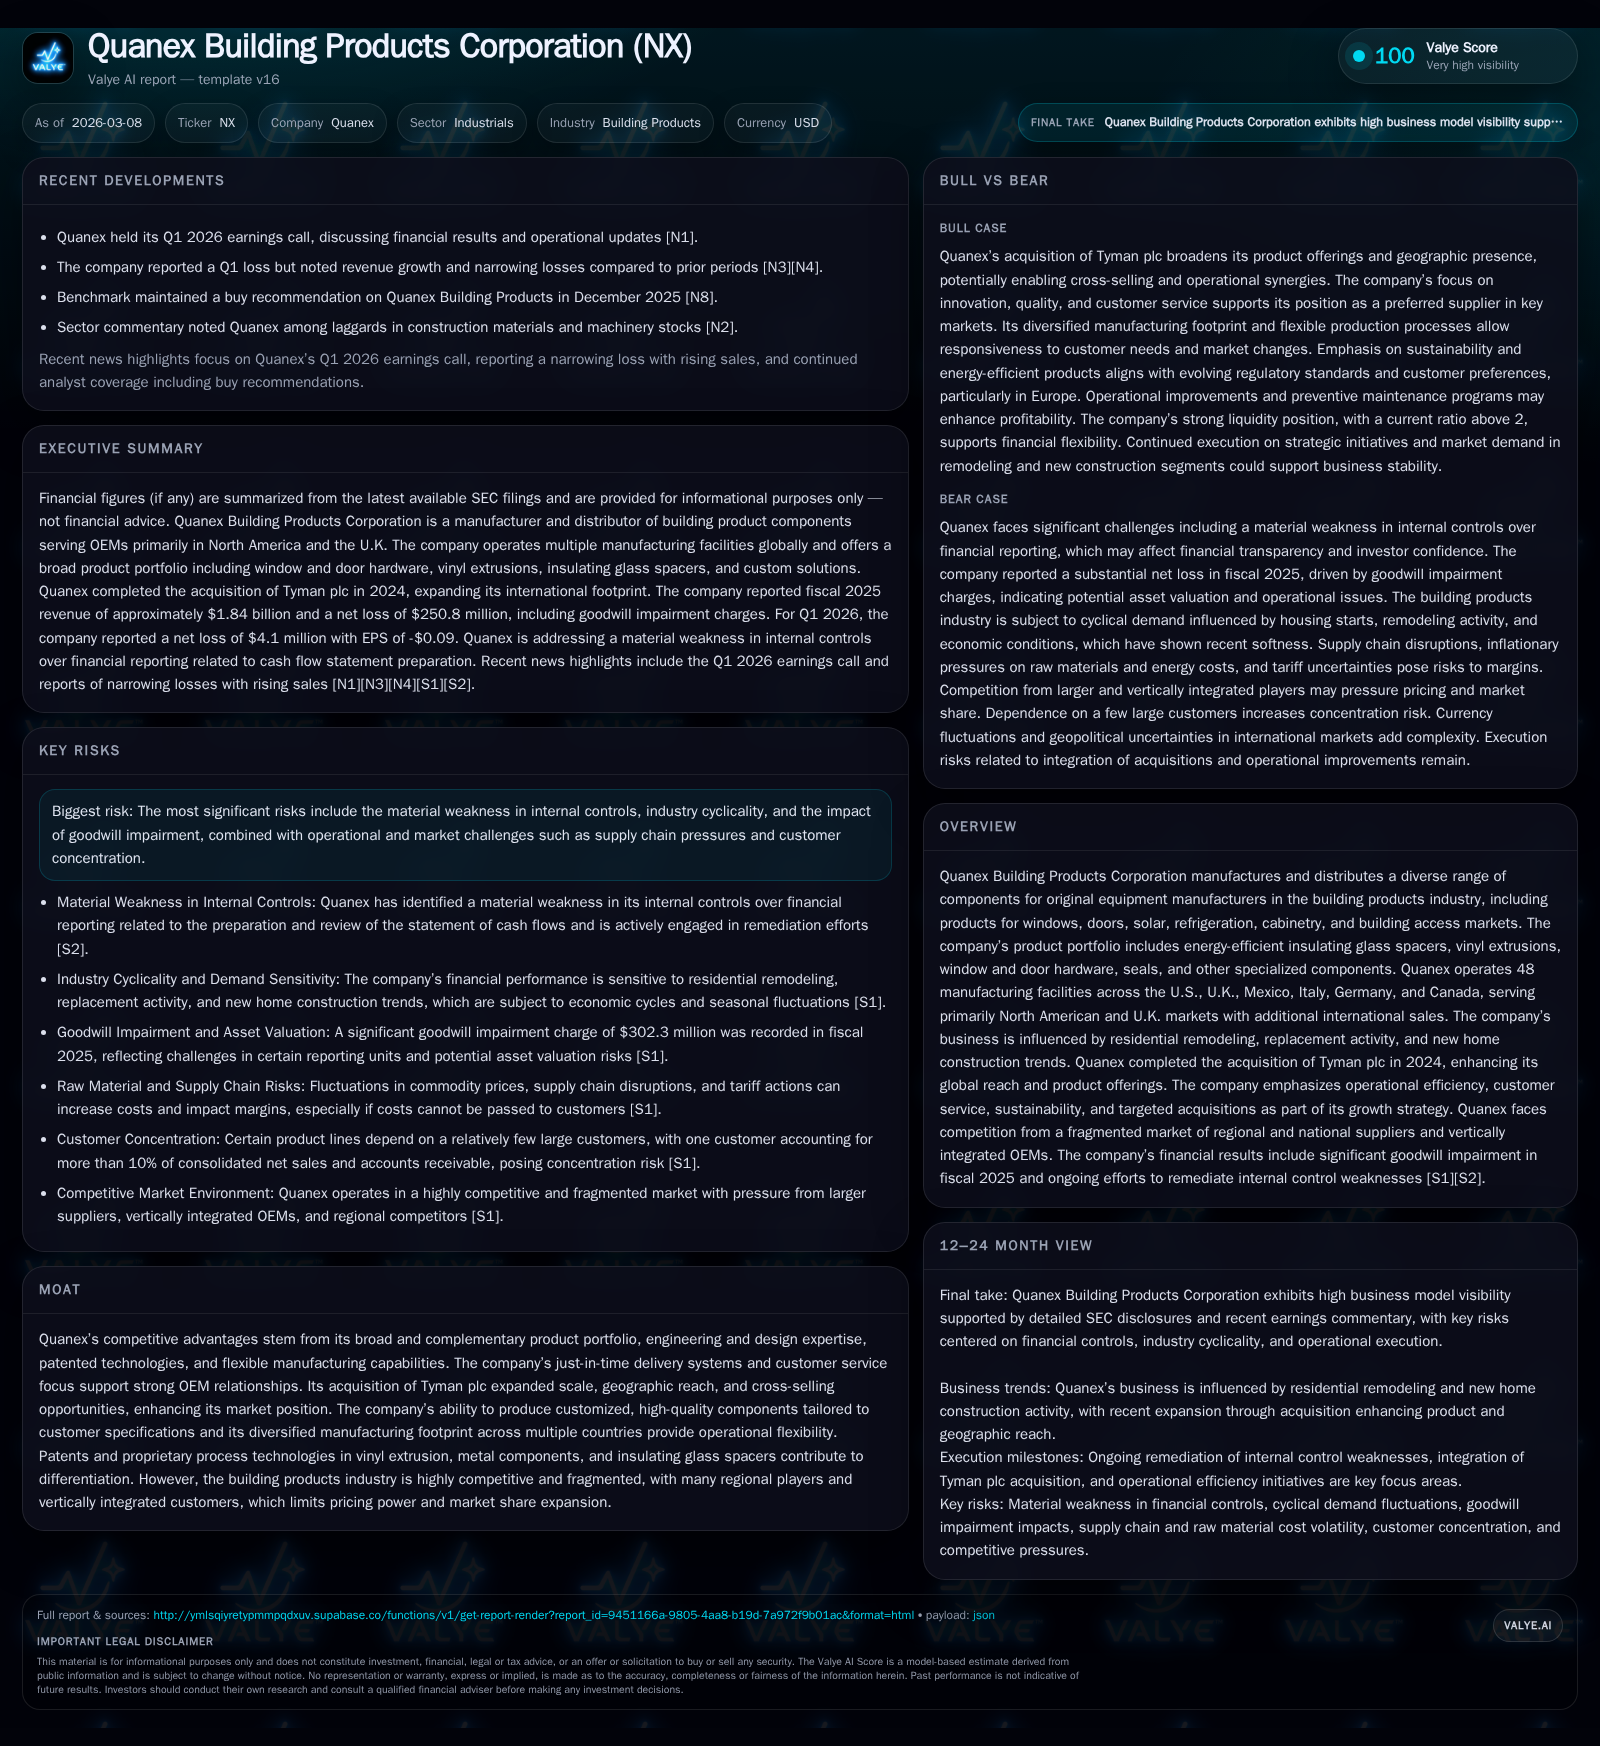
Quanex Building Products Corporation experienced a significant jump in revenue in fiscal 2025 due largely to its acquisition of Tyman plc, expanding its product portfolio and geographic presence. Despite this sales surge, the company reported a heavy operating loss and net loss driven by goodwill impairments and challenges within its hardware solutions segment. Operational efficiency efforts and restructuring plans are underway amidst internal control weaknesses. Capital allocation has balanced dividends and modest share repurchases alongside high capital expenditures, reflecting investment priorities post-acquisition. Going forward, performance will hinge on successful integration, market demand fluctuations in residential remodeling and construction, and remediation of controls.
Company Background and Acquisition Impact
Quanex Building Products Corporation is a diversified manufacturer and supplier of highly engineered components for original equipment manufacturers (OEMs) predominantly serving the building products industry — including windows, doors, solar panels, refrigeration units, cabinetry, and building access markets. With roots dating back to 1927 as Michigan Seamless Tube Company, Quanex evolved through various corporate structures before spinning off its building products business in 2008.
The company marked a transformative event with its acquisition of Tyman plc on August 1, 2024 [S1][S9]. Tyman’s complementary product lines and international footprint expanded Quanex significantly — nearly doubling scale and broadening customer reach. This move aimed to unlock cross-selling opportunities among OEM customers across North America and Europe.
As of October 31, 2025, Quanex operated 48 manufacturing facilities spanning the U.S., U.K., Mexico, Italy, Germany, and Canada — underscoring a geographically diverse footprint that supports operational flexibility [S1][S9].
Historical Financial Performance
Quanex’s fiscal year runs through October 31. The historical financial trajectory demonstrates substantial growth but also rising challenges:
Historical performance (annual)
| FY | Rev ($mm) | Net ($mm) | CFO ($mm) | OpInc ($mm) | Rev YoY | Net YoY |
|---|---|---|---|---|---|---|
| 2025 | 1838 | -251 | 165 | -194 | +43.8% | -858.7% |
| 2024 | 1278 | 33 | 89 | 55 | +13.0% | -59.9% |
| 2023 | 1131 | 83 | 147 | 111 | +267.6% | -6.6% |
| 2022 | 308 | 88 | 98 | 29 |
Source: SEC companyfacts cache [F1].
Capital returns and efficiency (annual)
| FY | Div ($mm) | Buybacks ($mm) | FCF ($mm) |
|---|---|---|---|
| 2025 | 15 | 32 | 102 |
| 2024 | 12 | 0 | 52 |
| 2023 | 11 | 6 | 110 |
| 2022 | 11 | 7 | 65 |
Source: SEC companyfacts cache [F1].
*Note: The significant revenue increase from FY2022 to FY2023 reflects prior acquisitions before Tyman.
The dramatic revenue increase in FY2025 reflects the Tyman acquisition’s impact since Q3/2024 [S9]. Prior to this deal, Quanex showed steady but modest organic growth.
Operating income exhibits volatility: profitable results pre-acquisition peaked at $110 million in FY2023 but flipped sharply negative by nearly $194 million in FY2025 [F1], primarily due to the goodwill impairment charge linked to acquisition-related reporting units facing operational difficulties [S11]. Net income followed a parallel deterioration pattern.
Notably, operating cash flow improved meaningfully in FY2025 despite profitability challenges—rising almost 86% year-over-year—indicating capacity for internal liquidity generation supporting capital investments [F1]. Capital expenditures increased significantly (+69%) reflecting investments presumably related to integration efforts and capacity enhancements post-acquisition.
Dividend distributions have been steady but modest relative to earnings trends; share repurchases resumed only recently after a pause pre-2025 [F1]. Return on equity has moved into negative territory (-34%) for FY2025 given losses exceeding equity base expansion [F1].
Business Segments and Operational Challenges
Quanex organizes its operations into three major segments: Hardware Solutions, Extruded Solutions, and Custom Solutions [S11][S25]:
- Hardware Solutions now includes window/door hardware following Tyman integration; this segment experienced significant goodwill writedowns ($163 million impairment across two reporting units) suggesting underperformance or overvaluation risks associated with acquired assets [S11].
- Extruded Solutions covers vinyl extrusions, seals/gaskets/spacers integral to energy-efficient fenestration; revenues expanded moderately but also felt competitive pressure [S14][S18].
- Custom Solutions include wood solutions, access solutions (recently added), and mixing solutions—all tailored components serving niche OEM needs.
The large goodwill impairment totaling $302 million recognized during FY2025 involved multiple reporting units: concentrated chiefly within Hardware but also present in Custom Solutions [S11][F1]. Some units were fully impaired indicating deep operational challenges or soft demand.
The company faces common industry cyclicality risks tied to residential remodeling seasonal patterns—sales are traditionally lower during winter months when home construction slows—and raw material price fluctuations affecting cost structures [S14].
Customer concentration remains notable; one customer accounted for over 10% of consolidated sales recently increasing credit exposure risk [S18]. Supply chain pressures persist amid complex multi-site operations across continents.
Internal Controls Remediation
Management disclosed ongoing remediation relating to a material weakness identified previously concerning internal controls over financial reporting specifically around preparation/review of cash flow statements [S2]. Controls enhancements include tighter validation procedures and staff training planned through October 2026 [S2].
While financial statements are currently reliable per management’s assertion, the lingering weakness presents potential risks for accurate cash flow classification which investors should monitor closely.
Liquidity, Capital Structure & Capital Allocation
Quanex maintains mixed financing sources including revolving credit facilities and term loans totaling approximately $641 million as of October 31, 2025 with maturity extending through August 2029 following amendments related to the Tyman acquisition [S4][S7][F1]. The company was compliant with covenants as of fiscal year-end.
Capital deployment balances sustaining operations with shareholder returns: capital expenditures rose above $60 million reflecting investment priorities post-acquisition; dividends paid totaled about $15 million annually; share repurchases resumed in FY2025 at approximately $32 million after no buybacks in prior year periods [F1][S6][S12]. No significant common stock issuance occurred aside from acquisition-related grants.
Outlook Considerations & Monitoring Points
Explicit quantitative guidance is not provided currently [N1][N2], so qualitative factors shape near-term outlook:
- Successful integration of Tyman plc remains critical to unlocking synergies while stabilizing underperforming hardware units.
- Residential remodeling cycle sensitivity may influence demand volatility given seasonality effects.
- Supply chain normalization and inventory management efficacy across global plants impact cost control.
- Resolution progress on internal control weaknesses could enhance confidence.
- Legal matters related to past product claims exist but are not expected materially adverse based on current disclosures [S8][S10].
- Monitoring quarterly earnings for margin recovery as restructuring initiatives advance is essential.
Conclusion
Quanex Building Products Corporation’s fiscal profile post-Tyman acquisition combines rapid top-line expansion with heightened complexity manifesting as significant operating losses driven largely by goodwill impairments primarily within Hardware Solutions units.[F1][S11] While strong operating cash flows support capital investments and maintain liquidity headroom,[F1] restoring sustainable profitability requires overcoming integration hurdles alongside managing cyclical industry pressures.[N2]
The company’s geographic breadth with manufacturing facilities across North America and Europe[S9] provides operational flexibility but adds complexity amid competitive dynamics.[S14] Stakeholders should closely track quarterly performance metrics alongside remediation milestones through calendar year 2026.[S2]
This report is an analytical overview based solely on publicly available disclosures including SEC filings and recent news sources as cited; it does not constitute investment advice or recommendations.*
Disclaimer: This is research-only, informational analysis and not investment advice. It may include AI-generated interpretation and general industry context. Always verify important details using primary sources.
Comments