
Cohen & Co Inc.’s Revenue Surge Reflects Strategic Diversification but Faces Market Volatility Risks
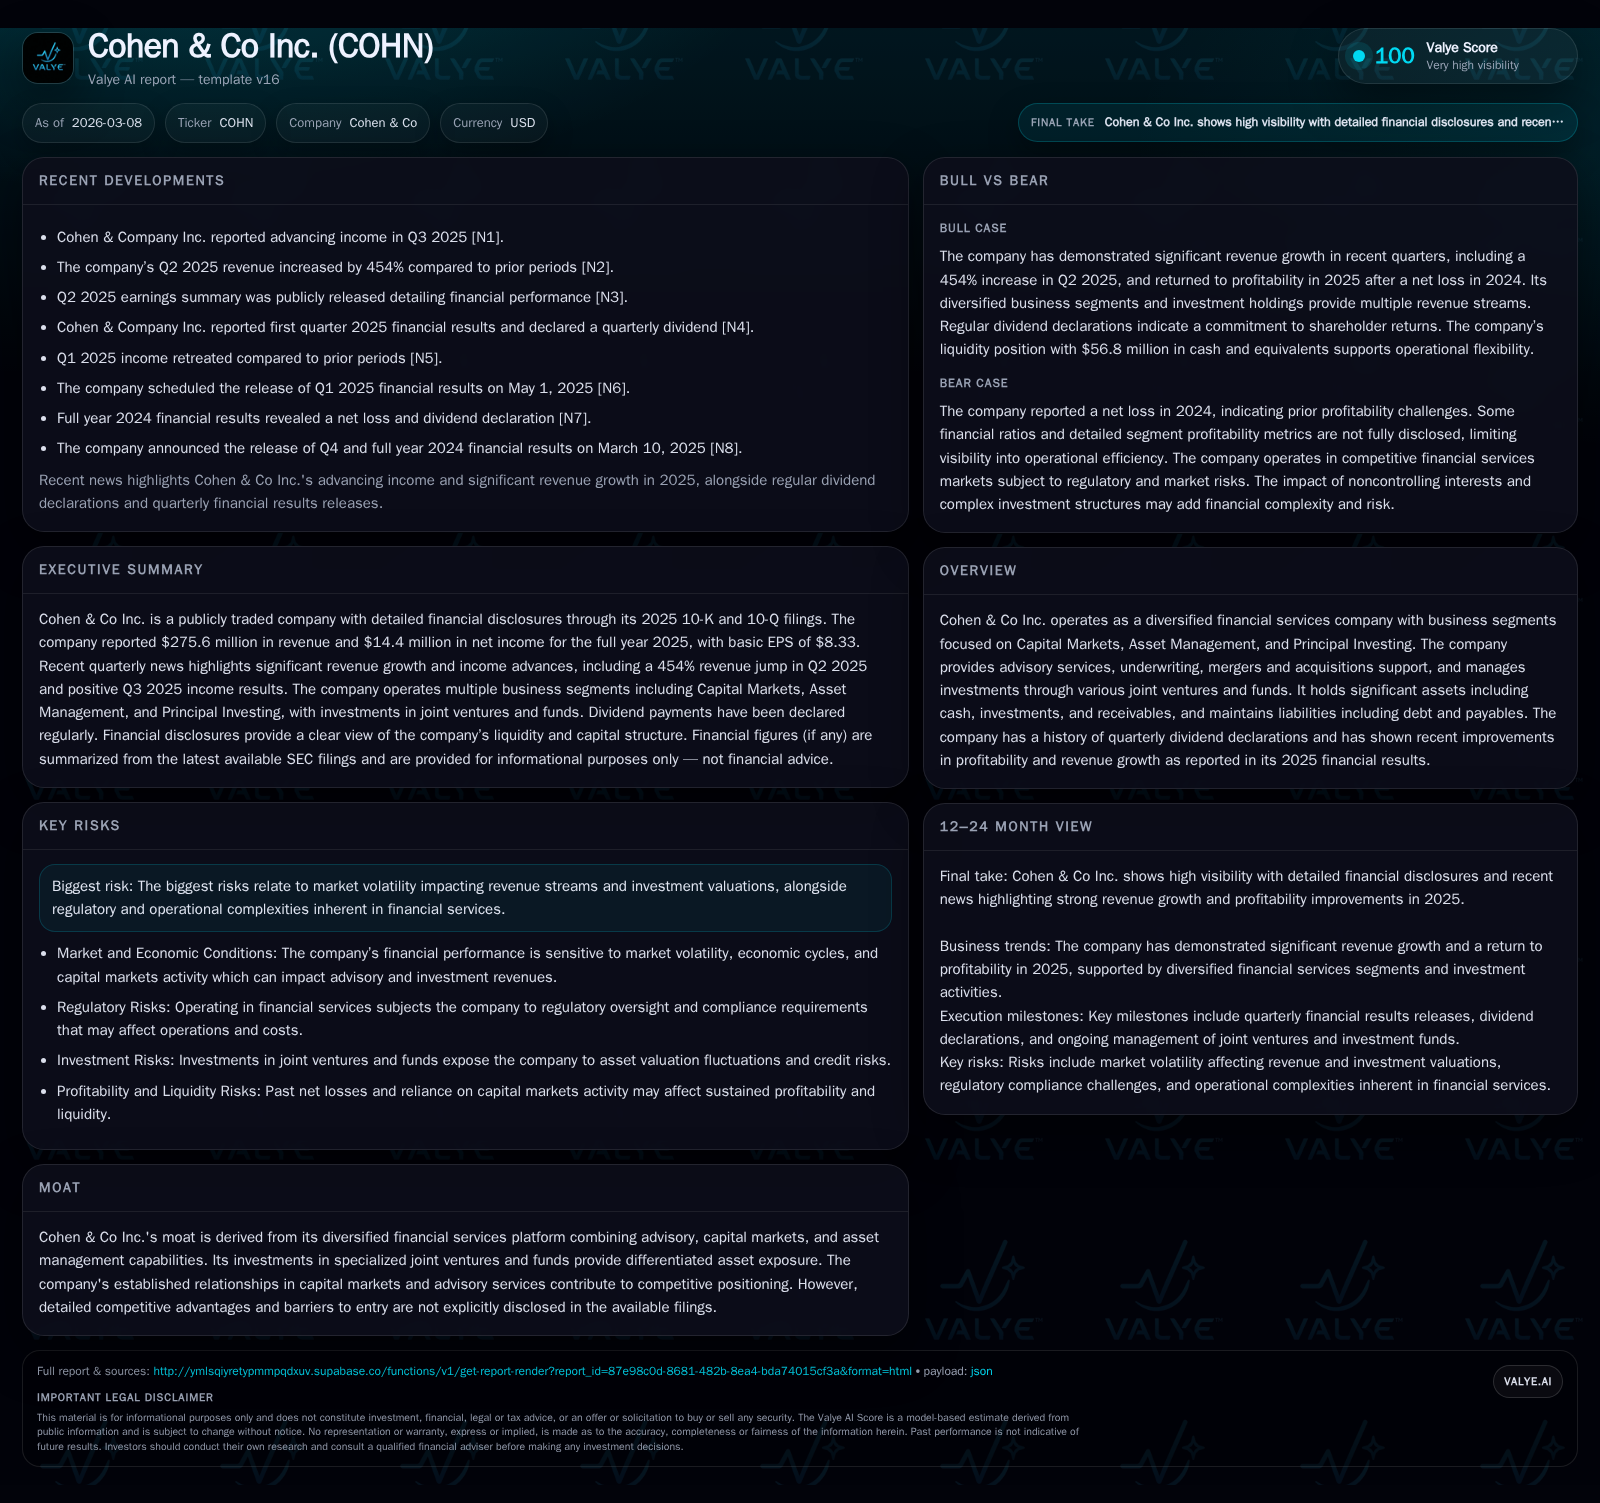
After years of earnings instability, Cohen & Co delivered a remarkable 246% revenue increase in 2025, driven by its multi-segment financial services platform.
Cohen & Co Inc. transformed its financial profile in 2025 with revenue climbing to $275.6 million, a sharp reversal from prior years’ losses. This growth originates from its diversified operations spanning capital markets, asset management, and principal investing, benefiting from enhanced deal activity and investment returns. However, sustained success depends on navigating market volatility risks and regulatory complexities inherent to the financial services industry. While profitability rebounded strongly alongside operating cash flow improvements, ongoing scrutiny of liquidity, capital structure, and investment performance will be crucial to maintaining momentum.
Historical Performance Highlights
Cohen & Co Inc.’s financial journey over the past four fiscal years exhibits a pronounced shift from consistent losses to thriving profitability by the end of 2025 [F1]. Revenue expanded dramatically from $44.4 million in 2022 to $275.6 million in 2025, representing an extraordinary 246% year-over-year increase from 2024 alone.
This reversal is mirrored in operating income metrics: after operating losses exceeding $27.9 million in 2022 and a loss of about $8 million in 2024, the firm achieved operating income above $59 million in 2025. Net income also turned positive at $14.4 million after recording losses for three consecutive years—$13.4 million loss in 2022 through a minimal loss of $129 thousand in 2024 [F1].
Cash flows tell a complementary story; operating cash flow (CFO) rose from negative levels (-$23.5 million in 2022) back into positive territory ($27.35 million for 2025), enabling robust free cash flow after accounting for relatively stable capital expenditures near $1.25 million annually [F1]. Equity capital increased steadily over this timeframe with a notable jump by $9 million from the prior year exceeding $51 million by year-end 2025.
Historical performance (annual)
| FY | Rev ($mm) | Net ($mm) | CFO ($mm) | OpInc ($mm) | Rev YoY | Net YoY |
|---|---|---|---|---|---|---|
| 2025 | 276 | 14 | 27 | 59 | +246.2% | +11286.8% |
| 2024 | 80 | 0 | 9 | -8 | -4.1% | +97.5% |
| 2023 | 83 | -5 | -40 | 7 | +86.9% | +61.8% |
| 2022 | 44 | -13 | -23 | -28 |
Source: SEC companyfacts cache [F1].
Capital returns and efficiency (annual)
| FY | Div ($mm) | Buybacks | FCF ($mm) |
|---|---|---|---|
| 2025 | 2 | 26 | |
| 2024 | 2 | 8 | |
| 2023 | 2 | 0 | -40 |
| 2022 | 3 | 0 | -24 |
Source: SEC companyfacts cache [F1].
The table summarizes key annual financial metrics from FY22 through FY25 showing considerable improvement especially in FY25.
Business Model and Segment Overview
Cohen & Co operates as a diversified financial services company with three primary business segments: Capital Markets advisory/underwriting/M&A support, Asset Management via specialized joint ventures and funds, and Principal Investing where it holds stakes across multiple entities [S1][S21].
The Capital Markets segment delivers advisory services on mergers and acquisitions along with underwriting support for clients ranging from institutional investors to corporate issuers—a full-service boutique investment banking function augmented by special purpose acquisition company (SPAC) advisory capabilities [S18]. Asset Management manages investments principally through joint ventures such as U.S Insurance JV targeting small insurance debt instruments; CREO JV focused on multifamily mortgage-backed loans; and European real estate funds like CK Capital Value Fund [S2][S7]. Principal Investing involves ownership stakes that generate returns via active investment management across various sectors.
Drivers of Growth
The surge in top-line revenue for FY25 appears driven by increased deal activity within Capital Markets—both heightened advisory engagements and underwriting volumes—alongside improved performance and expansions within affiliated asset management vehicles [S18]. The company's diversified portfolio approach helps smooth cyclical volatilities typical of pure advisory firms.
Moreover, recovering credit markets boosted valuations within its principal investing interests while generating gains recognized under fair value accounting [S15][S18]. Strategic initiatives around scaling SPAC advisory services likely contributed as well given broader market trends during the period.
Future Growth Prospects and Constraints
Continuing expansion will depend heavily on sustaining momentum in capital market activities amid evolving regulatory landscapes which pose compliance challenges [S20]. Investment-related revenues are susceptible to market volatility affecting asset valuations especially across real estate mortgage-backed securities central to some joint ventures.
Operationally, retaining skilled personnel capable of navigating complex transactions remains critical due to the expertise-driven nature of its services [S20]. Liquidity needs must be monitored carefully given exposure to short-term financing arrangements linked with trading counterparties.
Regulatory capital requirements imposed by federal agencies could cap leverage or necessitate raised capital thresholds that might constrain growth unless managed prudently [S20]. Furthermore, competition from larger banks and boutique firms vying for similar mandates may pressure margins.
Financial Forecasts and Milestones Watching Points
While explicit forward guidance is not disclosed publicly [N#],[S#], stakeholders should track quarterly Capital Markets deal pipelines, underlying asset valuations in joint ventures (particularly CREO JV's commercial real estate loans), and principal investing returns reported periodically [S2]. Dividend declarations continue quarterly though modestly scaled relative to earnings recovery reflecting cautious capital allocation priorities [F1].
Monitoring liquidity ratios alongside interest expense trends tied to junior subordinated notes—which carry high effective yields nearing ~20%—will indicate financial flexibility under stress scenarios [S16]. Investors may also want details on any new partnerships or expansions within SPAC advisory platforms which could signal incremental revenue channels.
Returns and Capital Allocation
Based on FY25 data, Cohen & Co generated an estimated return on equity around 28%, signifying strong profitability relative to shareholder equity base after protracted loss periods previously [F1]. Operating cash flows supported meaningful free cash flow generation approximating $26 million post capital expenses.
The company maintained dividend payments annually totaling slightly over $2 million in FY25, increasing marginally from prior years despite volatile earnings history indicating measured shareholder returns aligned with business stability.[F1]
No share repurchases occurred since FY21 suggesting reticence toward buybacks given prevailing market uncertainties; instead focusing on reinvestment within core operations and joint ventures.[F1]
Risk Profile Summary
Key risks entail:
- Market volatility impacting fee-based revenues and fair value investments particularly affecting asset management segment [S4][S20]
- Regulatory hurdles increasing compliance costs or restricting operational flexibility[S20]
- Counterparty credit risk stemming from broker-dealer receivables exposure requiring vigilant credit monitoring[S29]
- Interest rate fluctuations altering mortgage loan volumes relevant for CREO JV investments[S20]
- Potential litigation or employee misconduct risks inherent in financial services ecosystems[S20]
- Dependence on talent retention given competitive industry dynamics[S20]
These underline the importance of conservative risk controls even as revenues rebound.
Conclusion
Cohen & Co Inc.'s latest annual results reveal a striking recovery trajectory emanating from strategic diversification across financial services domains during an otherwise challenging macroeconomic backdrop. While the impressive gains demonstrate operational effectiveness and market position resilience,the sustainability hinges on adeptly managing regulatory complexities,multi-asset investment valuations,and maintaining robust liquidity amidst evolving industry conditions. Stakeholders should focus on quarterly segment disclosures,and joint venture performance metrics alongside capital structure evolution to gauge ongoing progress.
This analysis does not constitute investment advice but aims to synthesize publicly available data including SEC filings and financial statements up to March 2026.
Disclaimer: This is research-only, informational analysis and not investment advice. It may include AI-generated interpretation and general industry context. Always verify important details using primary sources.
Comments