
Ranpak Holdings Reports 7% Revenue Growth Driven by Proprietary Packaging and Automation Expansion
Revenue rose to $395 million in 2025 as Ranpak invested heavily in automation and geographic expansion while managing operating losses and supply chain risks.
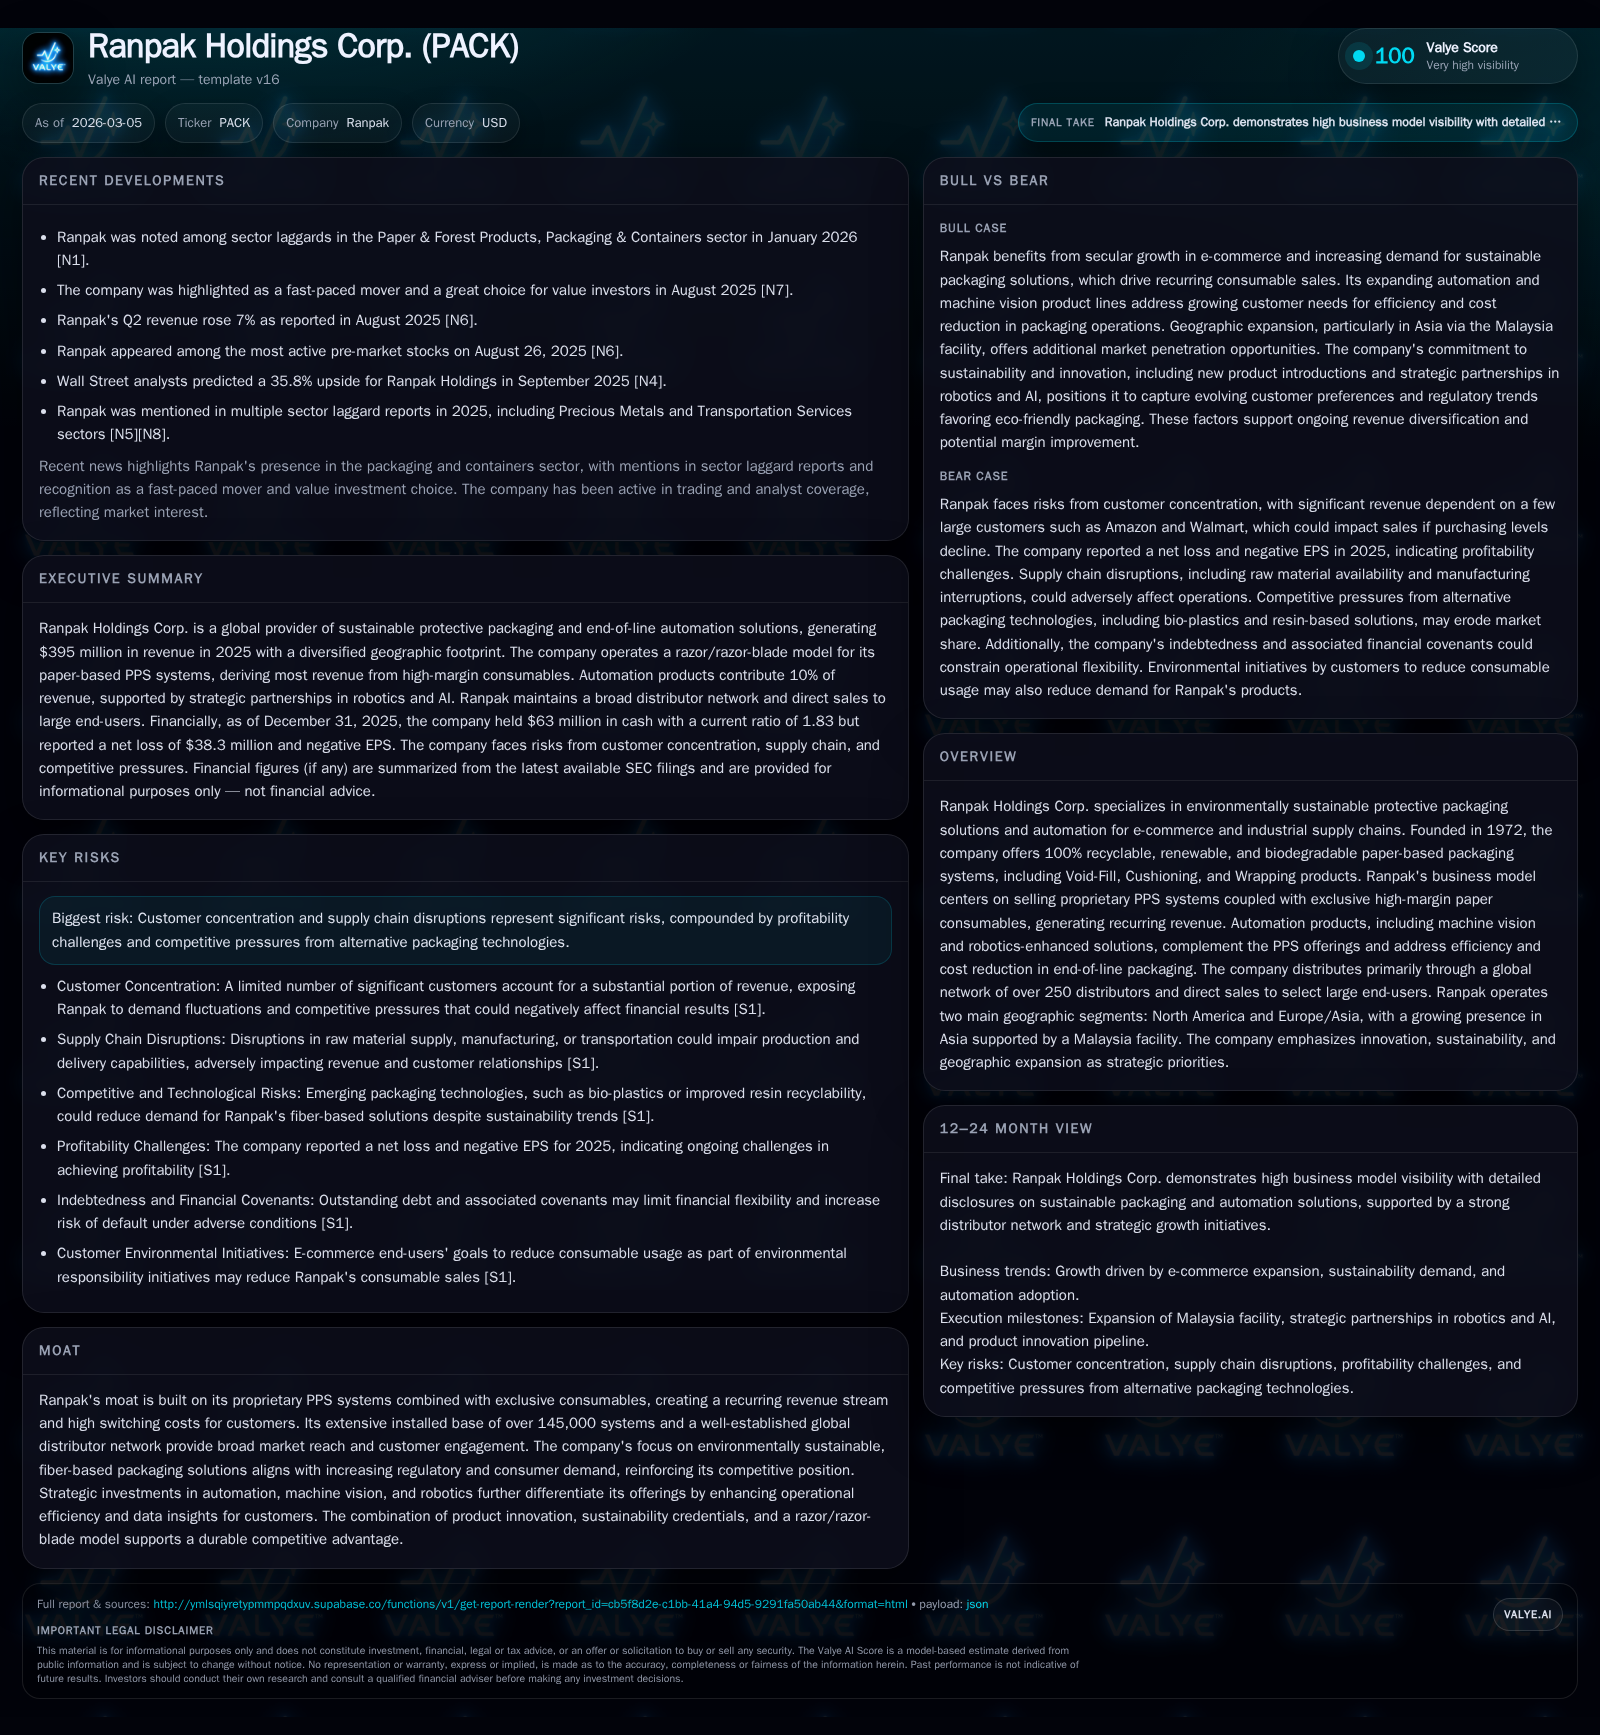
Ranpak Holdings Corp. reported revenue growth of 7.1% in 2025 to $395 million, despite operating losses widening to $24.3 million and net losses of $38.3 million. The company’s core business leverages a razor/razor-blade model with recurring high-margin consumable paper products tied exclusively to its proprietary protective packaging systems. Automation solutions contributed 10% of revenue, reflecting strategic investments in machine vision and robotics partnerships. Geographic diversification spans North America (47%), Europe (45%), and Asia (8%), supported by an expanding production footprint including a new Malaysia facility. Operating cash flow remained positive at $23.1 million, though free cash flow was negative due to substantial capital expenditures exceeding $55 million. Key risks include supplier concentration for kraft paper, customer concentration among large e-commerce end-users, supply chain disruptions, and evolving regulatory requirements on sustainable packaging. Growth drivers focus on global e-commerce expansion, sustainable cold chain solutions, and continued product innovation.
Revenue Growth with Profitability Challenges
Ranpak’s revenues have grown steadily from $326.5 million in FY2022 to $395.0 million in FY2025—a compound growth reflected by a 7.1% increase year-over-year in the latest fiscal year [F1]. Despite top-line growth, operating income deteriorated from a loss of $42.5 million in FY2022 to a loss of $24.3 million in FY2025. Net income followed this trend with losses widening to $38.3 million in FY2025 [F1][S1]. This divergence highlights margin compression influenced by inflationary pressures on input costs such as kraft paper, elevated operating expenses associated with scaling automation capabilities, and supply chain complexities.
The approximate return on equity stood at -7.2%, indicating that the company is currently generating losses relative to its equity base despite revenue gains [F1]. Operating cash flow remained positive at $23.1 million in FY2025 but declined significantly from prior years; free cash flow was negative due primarily to capital expenditures exceeding $55 million directed toward capacity expansion and technology investments.
Historical performance (annual)
| FY | Rev ($mm) | Net ($mm) | CFO ($mm) | OpInc ($mm) | Rev YoY | Net YoY |
|---|---|---|---|---|---|---|
| 2025 | 395 | -38 | 23 | -24 | +7.1% | -78.1% |
| 2024 | 369 | -21 | 41 | -13 | +9.7% | +20.7% |
| 2023 | 336 | -27 | 53 | -7 | +3.0% | +34.5% |
| 2022 | 327 | -41 | 1 | -42 |
Source: SEC companyfacts cache [F1].
Capital returns and efficiency (annual)
| FY | FCF ($mm) | ROE% |
|---|---|---|
| 2025 | -7.2 | |
| 2024 | -3.9 | |
| 2023 | -3 | -4.7 |
| 2022 | -44 | -6.8 |
Source: SEC companyfacts cache [F1].
Note: Capital expenditure data not available for FY2024 and FY2025.
Proprietary PPS Systems Drive Recurring Consumable Revenues
Ranpak’s Protective Packaging Solutions (PPS) business operates on a razor/razor-blade model where proprietary fiber-based packaging systems are paired with exclusive consumable paper products sold under mandatory minimum annual usage commitments [S5][S18]. This creates high switching costs for customers who must use Ranpak’s specialized consumables engineered for optimal performance with their installed PPS units.
Approximately 80% of net revenues are generated through a network of over 250 exclusive distributors worldwide who sell consumables under agreements that restrict promotion of competitors’ paper-based solutions [S19]. The remaining ~20% comes from direct sales to large-scale end-users requiring customized installations supported by dedicated engineering teams [S4][S5].
All packaging materials are fully recyclable, renewable, and biodegradable aligning with rising regulatory scrutiny against plastics and non-sustainable alternatives globally [S14]. This sustainability focus differentiates Ranpak as a leader in fiber-based protective packaging.
Growing Automation Segment Enhances Efficiency Offerings
Automation products—including Automated Paper Solutions (APS) and Automated Solutions (AS)—contributed approximately $39.1 million or about 10% of net revenue in FY2025 [S6][S17]. These solutions incorporate machine vision technology and robotics designed to automate void-fill insertion, box-sizing via right-sizing technology, case erection, closure functions, and quality control.
APS uses three-dimensional computer vision coupled with AI algorithms to dispense optimal amounts of protective paper dunnage reducing waste while AS automates box configuration processes lowering shipping costs [S17]. Strategic partnerships with companies like Pickle Robot Co., specializing in robotics for sorting/loading tasks, and Rabot Inc., providing machine vision insights for packing optimization, support this segment's growth.
These automated offerings not only reduce labor costs but also provide operational data analytics enabling customers to improve throughput rates and error monitoring—a critical advantage for high-volume logistics operations [S17].
Geographic Presence Supports Diversified Revenue Base
Ranpak’s geographic footprint is balanced between North America (47%), Europe (45%), and Asia/other regions (~8%) as of FY2025 [F1][S4][S8]. The North America segment includes operations across Ohio, Missouri, Nevada, and Connecticut; the Europe/Asia segment encompasses facilities in the Netherlands, Czech Republic, Malaysia among others.
The Malaysia full-service paper conversion plant became operational in the second half of 2024 enhancing regional supply reliability and cost competitiveness within the Asia-Pacific market [S8].
Distribution relies heavily on an exclusive network ensuring product fidelity while direct sales focus on large complex customers requiring tailored system integration supported by engineering services [S4][S19].
Capital Allocation Highlights: Cash Flow Generation Amid Heavy Investment
Operating cash flow remained positive at $23.1 million despite ongoing operating losses reflecting stable underlying cash generation from recurring consumable sales [F1]. However, free cash flow was negative approximately $32 million due to significant capital expenditures above $55 million invested primarily into expanding production capacity and advancing automation technologies.
Equity capital remains strong at approximately $535 million supporting these investments though returns remain subdued given persistent net losses translating into a negative ROE near -7%. Notably no share repurchases or dividends have been declared since FY2020 highlighting reinvestment priorities amid restructuring efforts [F1]. Liquidity is supported by a current ratio near 1.83x bolstered by roughly $63 million cash balances alongside available credit facilities detailed within debt covenants filings [F1][S23].
Risk Factors: Supplier Concentration & Customer Dependencies
Ranpak depends on a limited number of suppliers for kraft paper raw materials; one single supplier accounted for about 27% of global purchases in FY2025 exposing the company to supply disruptions or pricing volatility despite quarterly or semi-annual contract negotiations aimed at mitigating short-term fluctuations [S16]. Inventory buffers typically cover only five days’ raw material usage heightening exposure.
Customer concentration includes major e-commerce players such as Amazon and Walmart who represent significant revenue portions; shifts in purchasing patterns or sourcing strategies could materially impact results [S14][S20].
Regulatory risks stem from evolving environmental laws targeting plastics replacement which may increase compliance costs but also create opportunities for Ranpak’s fiber-based sustainable packaging solutions including cold chain liners like RecyCold® Climaliner Plus™ designed for perishable goods transport up to seventy-two hours [S24][S25].
Geopolitical tensions particularly trade frictions affecting Chinese imports pose ongoing risks given some PPS components are sourced externally; tariffs or export controls could disrupt supply chains or increase costs [S27]. Labor cost inflation across jurisdictions further pressures operating expenses.
Growth Outlook Anchored in E-Commerce Expansion & Sustainable Innovation
E-commerce remains a foundational growth driver contributing roughly four-in-ten dollars of Ranpak’s net revenue; continued expansion globally fuels demand for efficient void-fill packaging integrated into omnichannel logistics networks beyond traditional retail channels [S11].
The company is expanding into sustainable cold chain packaging solutions addressing rising consumer preferences for environmentally friendly food & beverage transit options; products like RecyCold® Climaliner Plus™ replace less sustainable foam coolers adding insulation performance critical post-pandemic consumer awareness trends [S10].
Ongoing product innovation includes next-generation fiber-based packaging solutions that enhance speed, efficacy and reduce packing footprint aligning well with tightening regulatory environments favoring biodegradable alternatives over plastics.
Key Performance Indicators To Monitor Going Forward
With no explicit forward guidance disclosed recently, investors should watch:
- Adoption rates of automation systems across distributor networks evidencing traction in complex client deployments;
- Margin recovery efforts addressing input cost inflation through pricing discipline or cost pass-throughs;
- Execution progress on geographic expansion especially utilization improvements at the Malaysia facility supporting APAC growth;
- Supply chain risk mitigation initiatives including supplier diversification or inventory buffer enhancements;
- Potential accretive mergers & acquisitions targeting adjacent technologies or product lines enhancing competitive positioning;
- Customer mix shifts particularly changes among major e-commerce accounts sensitive to macroeconomic conditions.
Together these factors will illuminate Ranpak’s ability to reconcile top-line growth momentum with profitability enhancement amid an evolving competitive landscape driven by technological innovation and sustainability imperatives.
This analysis is provided solely for informational purposes without any investment recommendation.
Disclaimer: This is research-only, informational analysis and not investment advice. It may include AI-generated interpretation and general industry context. Always verify important details using primary sources.
Comments