
ONE LIBERTY PROPERTIES’ Industrial-Focused Portfolio Drives Steady Growth and Navigates Debt Maturities
Stable occupancy and net lease structures underpin One Liberty’s consistent income amidst debt refinancings and market challenges.
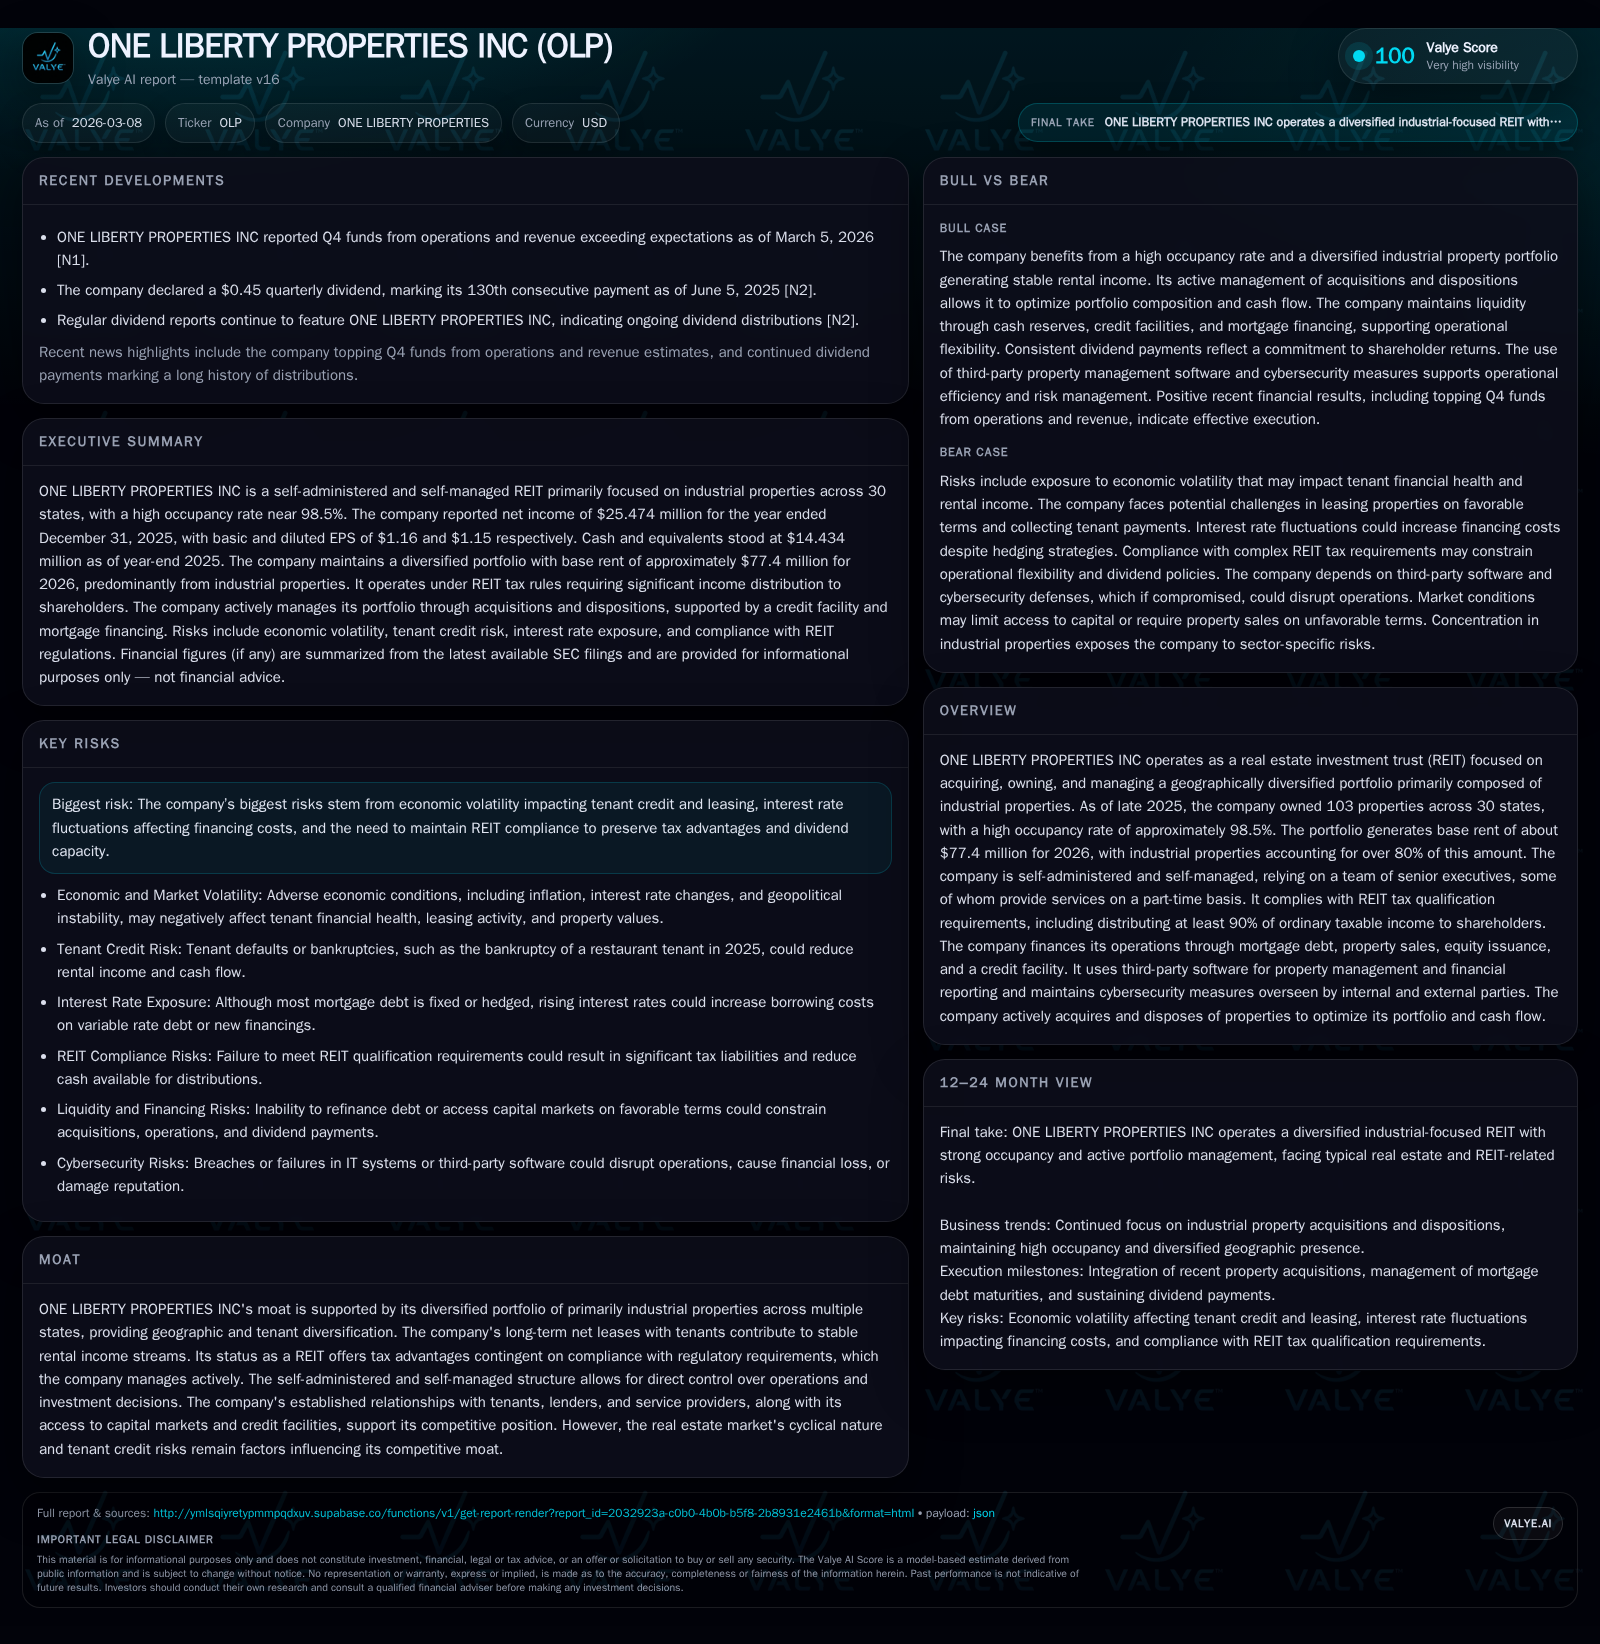
One Liberty Properties Inc (OLP) maintains a geographically diversified portfolio dominated by industrial real estate, reflecting a high occupancy rate near 98.5% as of end-2025. Revenues grew steadily through 2021, while operating income declined modestly in 2025. Net income surged notably in 2025, supported by operational factors. The company manages liquidity via mortgage financings, property sales, and an undrawn credit facility amid upcoming debt maturities. Capital allocation prioritizes dividends with limited recent share repurchases. Inflation and interest rate environments, alongside tenant credit risk, remain considerations.
Company Overview and Business Model
One Liberty Properties Inc (ticker: OLP) operates as a self-administered and self-managed real estate investment trust (REIT) focused primarily on acquiring, owning, and managing a geographically diversified portfolio of industrial properties across the United States [N1][S1]. As of December 31, 2025, OLP owned 103 properties located in approximately 30 states with expected base rent of roughly $77.4 million for calendar year 2026; over 80% of this base rent is derived from industrial assets [S1]. The company emphasizes long-term net leases that provide stable rental income streams.
The self-administered management structure includes several senior executives who serve on a full- or part-time basis to balance operational cost efficiency against potential concentration risks given their critical roles [S1].
Historical Performance Trends
Revenue and Profitability
Historical revenue data show OLP generated $21.07 million in revenue for FY2021—a 12.5% increase from $18.73 million in FY2020—with fluctuations over preceding years due to acquisitions and portfolio changes [F1]. While explicit recent revenue figures beyond FY2021 are not available, operating income for FY2025 was reported at $47.91 million—a decline of approximately 4% from $49.90 million in FY2024—indicating some margin compression or seasonal impacts despite steady rental income [F1].
Net income surged significantly to $25.47 million in FY2025 from $10.53 million the prior year [+141.9% YoY], likely reflecting improved operational efficiencies or non-recurring items given the scale of increase relative to operating income changes [F1].
Operating cash flow slipped moderately by about 3.9% to $37.52 million in FY2025 from $39.06 million in FY2024 but remains sufficient to support ongoing capital needs and dividends [F1]. This reflects the REIT’s focus on long-term leases generating recurring cash flows.
Historical performance (annual)
| FY | Net ($mm) | CFO ($mm) | OpInc ($mm) | Net YoY |
|---|---|---|---|---|
| 2025 | 25 | 38 | 48 | +141.9% |
| 2024 | 11 | 39 | 50 | -29.6% |
| 2023 | 15 | 46 | 50 | +68.4% |
| 2022 | 9 | 44 | 54 |
Source: SEC companyfacts cache [F1].
Capital returns and efficiency (annual)
| FY | Div ($mm) | Buybacks ($mm) | ROE% |
|---|---|---|---|
| 2025 | 39 | 10 | 8.5 |
| 2024 | 38 | 10 | 3.4 |
| 2023 | 38 | 10 | 4.9 |
| 2022 | 38 | 5 | 2.8 |
Source: SEC companyfacts cache [F1].
Note: Revenue data available only through FY2021; subsequent years include operating income and other key metrics.
Portfolio Composition and Leasing Profile
OLP’s portfolio is heavily weighted toward industrial real estate assets such as warehouses and distribution centers—sectors benefiting from secular trends like e-commerce growth—providing resilience during economic cycles [N1][S1]. These properties are leased predominantly under long-term triple-net leases where tenants assume taxes, insurance, and maintenance costs, reducing landlord expense volatility.
Occupancy levels have remained high at approximately 98.5% as of December 31, 2025—stable compared to previous years around ~99%—reflecting strong tenant retention and demand [S1].
Geographic diversification spans roughly thirty states, mitigating concentration risk across markets and industries [N1][S1]. Tenants are generally creditworthy companies secured under long-term lease agreements that stabilize cash inflows.
Financing Structure and Debt Profile
Debt constitutes a significant component of OLP’s capital structure with fixed-rate first mortgage loans secured on individual properties totaling about $522.5 million gross balance at December 31, 2025—up materially from roughly $425 million at the end of the prior year—driven by new financings and refinancing activities during the period [F1][S8][S16]. Interest rates on these mortgages range between approximately 3%-6%, averaging near mid-4-percent levels after swap arrangements [S16]. Maturities span from near term through the mid-2040s.
The company also maintains a revolving credit facility capped at $100 million maturing at the end of calendar year 2026 which was undrawn as of December 31, 2025 providing liquidity flexibility; borrowing costs range from SOFR +175 basis points to +275 basis points based on leverage ratios with covenants restricting liens and leverage levels [S4][S5][S20].
Upcoming contractual obligations include:
- Approximately $28.9 million amortization payments due during calendar year 2026,
- About $48.7 million amortization payments through next two years,
- Roughly $39.7 million amortization scheduled through year-end 2028,
- Principal maturities aggregating around $117 million within this period requiring refinancing or repayment via cash flow or asset sales [S8][S18][S21].
Historically, OLP has generated proceeds from property sales exceeding $61 million net during calendar year 2025 along with mortgage financings yielding net proceeds around $129 million supporting refinancing needs without equity issuance so far [S12].
Capital Allocation: Dividends and Buybacks
Consistent with REIT requirements to distribute at least ninety percent of taxable ordinary income, OLP has maintained steady dividends approximating $1.80 per share annually for recent years including through FY25 with quarterly dividends continuing into early-2026 filings [F1][N6][S17]. Annual dividends paid approximate nearly $39 million indicating payout coverage aligned with cash flow generation.
Share repurchases have been limited recently; while the Board authorized repurchase programs previously leading to cumulative buybacks approximating $9.6 million before calendar year-end '25, no repurchases were executed during the latest fiscal year reflecting management’s preference for liquidity preservation amid upcoming debt maturities [F1][S19].
Growth Drivers and Constraints Analysis
Growth Drivers:
- Industrial asset class benefits from e-commerce-driven demand for logistics/distribution space.
- High occupancy levels near full utilization sustain predictable rental revenues.
- Long-term triple-net leases provide steady cash flows insulated partially from inflationary cost pressures.
- Geographic diversification reduces localized market downturn risks.
- Fixed-rate mortgage debt combined with interest rate swaps aids expense predictability amid rising rates.
Constraints:
- Commercial real estate cycles present tenant credit risks affecting rent collection or lease renewals amid economic uncertainty [S2].
- Substantial mortgage maturities approaching require successful refinancing or asset sales potentially under less favorable conditions if markets tighten or valuations soften [S8].
- Inflation may pressure operating costs and financing expenses especially if credit facility usage increases floating rate exposure [S20].
- Management reliance on part-time service by some senior executives introduces execution risk if retention falters [S1].
Outlook: What To Monitor Going Forward
In absence of explicit forward guidance beyond dividend declarations, key areas for investors include:
- Management’s execution on refinancing or repayment strategies for mortgage maturities due through next three years.
- Maintenance of occupancy levels amid post-pandemic supply chain normalization.
- Effectiveness of rent escalations versus inflationary cost increases impacting net returns.
- Potential reactivation of share repurchases should liquidity improve beyond dividend commitments.
- Changes in governance or personnel impacting management bandwidth given current part-time service arrangements noted.
Conclusion
One Liberty Properties presents a financially solid profile supported by a sizable industrial real estate portfolio underpinned by strong occupancy and long-term net leases producing dependable cash flows—a characteristic strength for REITs focused on logistics assets today. Medium-term debt maturities necessitate active balance sheet management amid macroeconomic uncertainties affecting credit markets and leasing fundamentals alike. Ongoing capital recycling strategies alongside tenant credit exposures represent principal near-term risks despite otherwise steady operational metrics thus far. This profile reflects disciplined balance between growth opportunities and conservative leverage maintaining REIT compliance while delivering resilient dividends amid evolving economic conditions.
This analysis has been prepared solely for informational purposes without offering investment advice.
Disclaimer: This is research-only, informational analysis and not investment advice. It may include AI-generated interpretation and general industry context. Always verify important details using primary sources.
Comments