
Cerus Corp’s Q2 Revenue Acceleration Highlights Biotech Commercial Momentum Despite Ongoing Losses
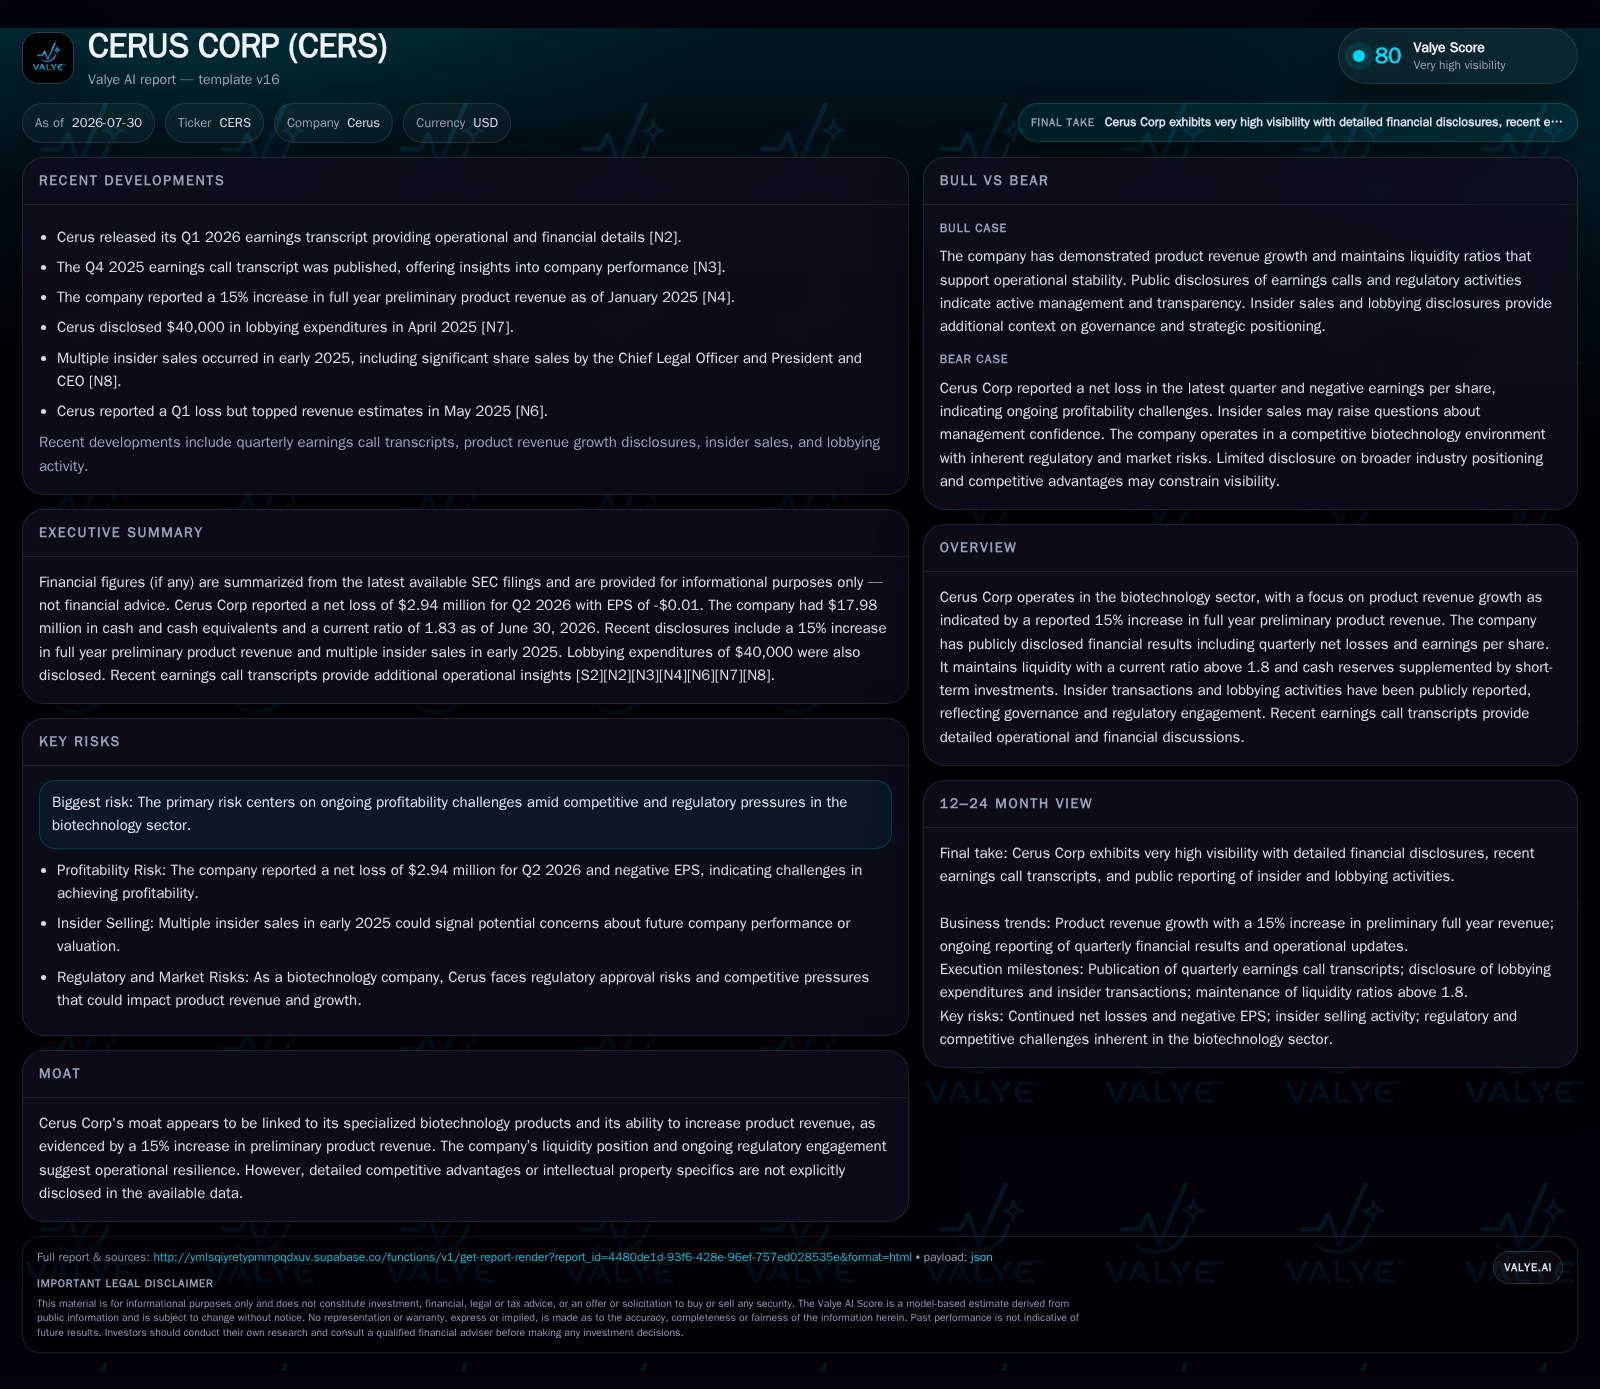
Cerus reports a robust 15% increase in product revenue for Q2 2026 amid persistent net losses, illustrating commercial growth traction within a capital-intensive biotech framework.
Cerus Corporation’s second quarter 2026 results show a meaningful acceleration in product revenue growth, with preliminary figures indicating a 15% year-over-year increase. This growth underscores successful commercialization efforts for their specialized biologic products despite ongoing operating losses typical of mid-stage biotech firms. The company maintains a solid liquidity position with a current ratio near 1.8 and $18 million in cash reserves, supported by $65 million total debt, reflecting cautious capital management amid R&D and manufacturing scale-up costs. Regulatory risks remain a pivotal factor influencing the timing of further market expansion and product pipeline maturation.
Q2 Growth Signals Validate Commercial Momentum Against Operating Losses
Cerus Corporation’s second quarter ended June 30, 2026, delivered an encouraging signal of commercial momentum through an approximate 15% increase in preliminary product revenue compared to prior periods [S2], [S3]. This figure marks a material improvement in top-line trends, indicating deeper market penetration and adoption of Cerus' biotechnology products specializing in pathogen reduction and blood safety. However, this revenue growth contrasts with continuing net losses typical in biotechnological firms investing heavily in product development and commercialization scaling [F1]. The coexistence of accelerating sales alongside negative earnings underlines a familiar biotech pattern: early commercialization requires sustained capital burn before profitability inflection.
The reported net losses reflect ongoing expenses related to research and development (R&D), regulatory compliance, manufacturing scale-up, and sales force expansion essential to support sustained revenue gains. Confirmation signals for durable growth would include consistent sequential quarterly revenue increases exceeding the current double-digit pace, margin stabilization, or improvement, and greater contribution from higher-margin licensing or milestone payments if they become material.
Bioscience Value Proposition: How Cerus Captures Market Demand for Specialized Biologics
Cerus operates primarily within the biotechnology space focusing on specialized biologics aimed at improving blood safety through pathogen reduction technologies for use by hospitals, blood banks, and clinical laboratories. Its business model generates revenues chiefly from the sale of these proprietary products that have cleared regulatory hurdles necessary for market access [S1]. Customers are institutional healthcare providers who prioritize safety standards mandated by regulation and driven by patient care protocols.
This sector’s economic mechanics involve upfront manufacturing investments coupled with ongoing clinical validation to maintain approvals. Intellectual property (IP) forms a critical barrier protecting innovations from generic substitution. Cerus’ revenues may also be supplemented by licensing agreements or milestone payments when partnering with other entities for product development or geographic expansion; however, such streams are secondary compared to direct product sales as per available disclosures. The strength of Cerus’ value proposition hinges on its ability to meet stringent regulatory benchmarks while demonstrating measurable efficacy advantages that justify customers’ switching costs from incumbent technologies.
Competitive Landscape: Peers and Pricing Pressure in the Biotech Product Commercialization Arena
Within the broader biotechnology ecosystem, Cerus competes alongside other product developers engaged in specialized medical device and biologics markets such as Bio-Rad Laboratories or Illumina (as peer candidates). These competitors similarly navigate the dual challenge of scaling revenues while managing protracted investments into R&D amid evolving regulatory requirements.
Pricing power is moderated by regulator-mandated usage guidelines, reimbursement policies, and competitive alternatives entering the marketplace. Consequently, gross margins face pressure from both input cost inflation tied to manufacturing scale-up and constraints on passing full cost increases to institutional buyers due to negotiated procurement contracts. Sustained margin improvements depend heavily on gaining volume leverage as manufacturing capacity utilization rises alongside expanding market acceptance.
Regulatory Milestones and Risks: Impact on Product Pipeline Maturation and Market Access Timing
Regulatory approval timelines are pivotal factors dictating Cerus’ pathway toward broader commercialization and financial sustainability [S1], [S2], [S23]. The progression of clinical trials validating safety and efficacy directly influences subsequent FDA approvals or equivalent global agency clearances required for new indications or geographic market entry.
Cerus’ filings highlight these approvals as gating events with associated risks around delays or failures that could extend clinical development cycles. Such uncertainties typically delay revenues realization beyond initial projections thereby lengthening cash burn periods. Active engagement with regulators combined with incremental submission achievements serve as crucial indicators to assess pipeline health.
Key Constraints: Profitability Pressures Amid R&D Intensity and Manufacturing Scale-up Costs
Despite growing revenues, Cerus remains challenged by profitability headwinds stemming from its capital-intensive operating model. Significant expenditures flow into sustained R&D efforts necessary not only for maintaining existing product registrations but also developing next-generation enhancements or new applications [S1], compounded by manufacturing scale-up costs required to meet rising demand.
This combination creates ongoing pressure on operating margins as fixed cost bases expand faster than early-stage incremental sales contributions. The resultant net losses typify mid-stage biotech firms positioned between breakthrough regulatory milestones and achieving economies of scale necessary for sustainable positive cash flow.
"Catalysts Ahead": Milestones to Watch Including Approval Timelines and Demand Upticks
Looking forward, key indicators that will shed light on Cerus’ potential trajectory include upcoming regulatory submission deadlines and clinical trial progress updates that may trigger new approvals or expanded indications [S2], [S3]. Additionally, meaningful volume uplifts from customer ordering patterns could validate commercial adoption beyond pilot phases.
Strategic partnerships granting licensing rights or territorial expansions would provide further confirmation signals supporting durability of current revenue acceleration. Monitoring these milestones provides crucial checkpoints for assessing whether Cerus successfully transitions from developmental risk exposure toward stable commercial growth phases.
Financial Profile Discussion: Managing Liquidity Amid Innovation-Driven Cost Structure
As of June 30, 2026, Cerus reported cash and cash equivalents of approximately $18 million, total debt near $65 million, and net debt around $47 million, with current assets of $157 million and current liabilities of $86 million [F1]
In summary, Cerus demonstrates strengthening top-line momentum driven by its core biotech products amidst an environment marked by inherent profitability challenges due to sector-specific cost structures. Regulatory events remain central determinants of future growth inflection points while careful liquidity stewardship supports continuity through developmental cycles.
Disclaimer: This is research-only, informational analysis and not investment advice. It may include AI-generated interpretation and general industry context. Always verify important details using primary sources.

Comments