
Financial Strain Pushes China Pharma Holdings Toward Strategic Liquidity Moves
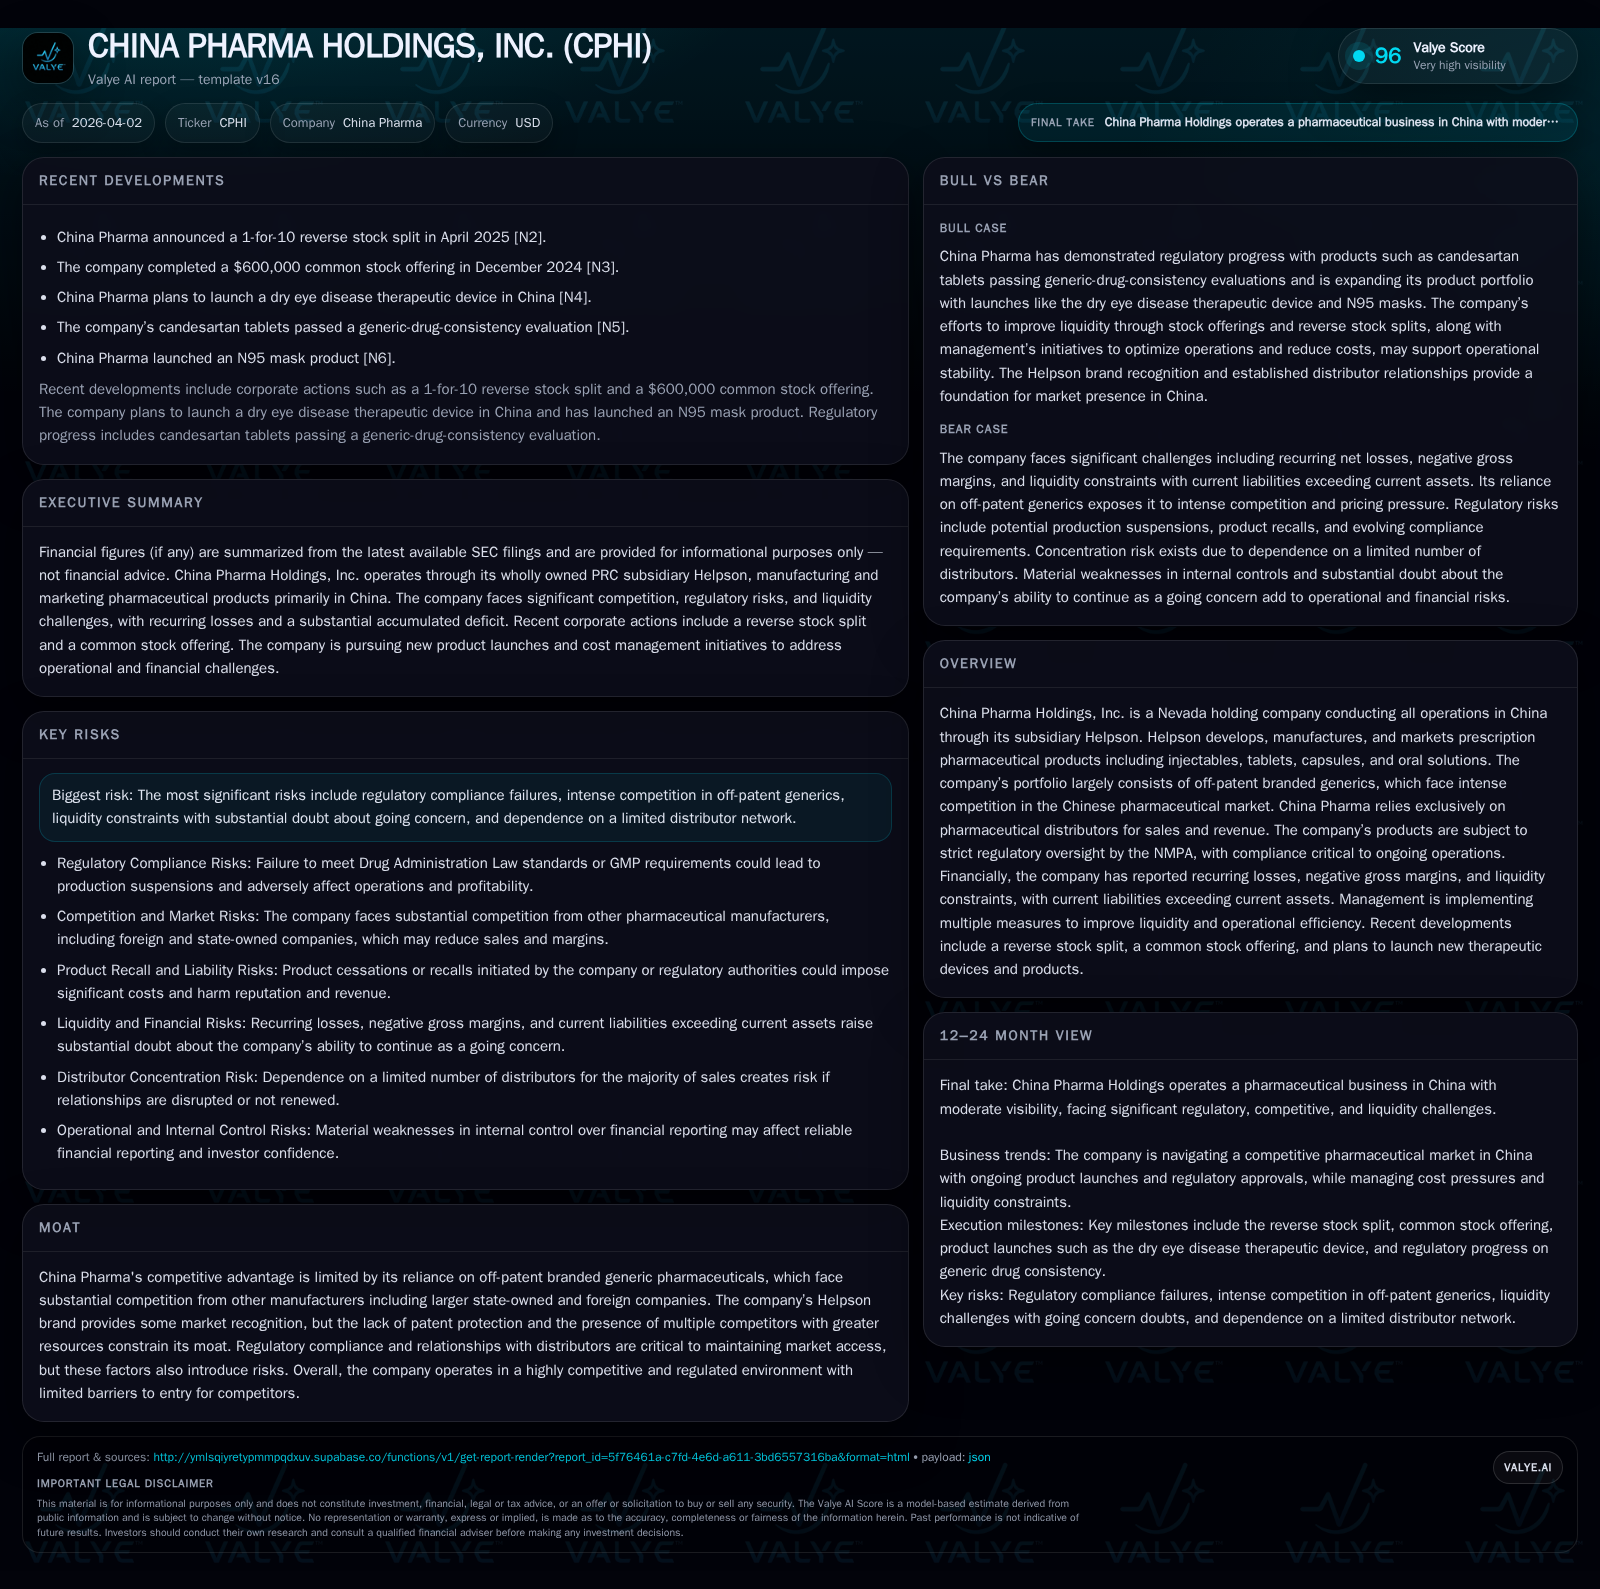
China Pharma Holdings contends with declining revenues, sustained losses, and liquidity pressures within a fiercely competitive Chinese generics market reliant on distributor partnerships.
China Pharma Holdings operates through its subsidiary Helpson in China’s off-patent branded generics pharmaceutical sector, facing intensified competition and stringent regulatory oversight. Over the last four fiscal years ending 2025, the company experienced a nearly 49% revenue decline coupled with persistent operating losses exceeding $3 million annually. Operating cash flow turned positive in 2025 signaling slight operational improvements, yet severe liquidity constraints remain with a current ratio of 0.32 and reliance on credit lines personally guaranteed by management. The company depends exclusively on a handful of distributors without long-term binding contracts, exposing it to sales concentration and collection risks. Management is pursuing cost efficiencies, strategic technology transfers, and exploring portfolio expansion to arrest the decline but faces structural challenges in brand leverage and product innovation amid regulatory hurdles.
Declining Revenue and Loss Trends: Historical Financial Review
China Pharma Holdings has experienced a steady contraction in revenues over the past four fiscal years, falling from approximately $8.1 million in FY2022 to $4.1 million in FY2025 — representing a cumulative decrease of nearly 49% [F1]. The year-over-year decline from FY2024 to FY2025 alone was about 8.5%. Operating income remained negative throughout this period, with losses narrowing somewhat to -$3.2 million in FY2025 from -$4.6 million in FY2024 [F1]. Net income followed a similar pattern, reflecting persistent deficits that slightly improved to -$3.2 million in the latest fiscal year.
Despite ongoing operating losses, operating cash flow showed notable improvement turning positive at $148k in FY2025 compared with negative figures such as -$466k in FY2024 [F1]. Capital expenditures remained restrained at $59k for FY2025 following lower spend levels relative to historical peaks like those seen in 2022 [F1]. The company’s approximate return on equity was around -14%, indicating continued erosion of shareholder value due to operational deficits [F1].
Historical performance (annual)
| FY | Rev ($mm) | Net ($mm) | CFO ($) | OpInc ($mm) | Rev YoY | Net YoY |
|---|---|---|---|---|---|---|
| 2025 | 4 | -3 | 148261 | -3 | -8.5% | +32.7% |
| 2024 | 5 | -5 | -466362 | -5 | -35.4% | -53.8% |
| 2023 | 7 | -3 | -699686 | -3 | -13.5% | +22.5% |
| 2022 | 8 | -4 | -409545 | -4 |
Source: SEC companyfacts cache [F1].
Capital returns and efficiency (annual)
| FY | FCF ($) | ROE% |
|---|---|---|
| 2025 | 88937 | -14.0 |
| 2024 | -504773 | -61.1 |
| 2023 | -41.3 | |
| 2022 | -811509 | -92.6 |
Source: SEC companyfacts cache [F1].
All figures sourced directly from reported financials [F1].
Competitive Pressures in China’s Branded Generics Market
Helpson’s portfolio consists mainly of off-patent branded generic pharmaceuticals sold within China's highly fragmented generics market characterized by intense competition from larger state-owned enterprises and multinational companies with greater scale and resources [S19]. Vendors compete aggressively via tender bidding processes conducted by public hospitals and government agencies under China’s National Medical Insurance Program.
These tender-driven sales dynamics impose steep discounting pressures due to volume-based procurement contracts tied to government price ceilings on essential drug list products [S20]. Additionally, manufacturers must comply with the "Consistency Evaluation" mandated by the National Medical Products Administration (NMPA), ensuring bioequivalence and quality parity with original developers [S24]. Failure or delays here can disqualify products from tenders or reduce distributor preference.
The Helpson brand offers limited differentiation since branded generics without intellectual property protection face commoditized competition limiting pricing power [S19]. Pricing conflicts also arise from competing generics targeting identical tender categories.
Distribution Network Dependence: Risks and Operational Impacts
China Pharma relies exclusively on pharmaceutical distributors for all sales revenue generation [S1][S5]. There are no binding long-term distribution agreements; transactions occur through purchase orders without continuing obligations for future volumes [S4]. This exposes the company to risk if major distributors cease purchasing or switch to competitors.
Accounts receivable concentration is notable: three customers accounted for approximately 39%, 14%, and 9% of total receivables at fiscal year-end 2025 [S4], indicating concentrated credit risk.
Distributor payment terms extend up to 90 days due to delayed payments by state-owned hospitals downstream [S13], embedding additional collection risk [S6]. Distributors may also carry competing products creating channel conflicts that could undermine Helpson's market presence [S5]. Such dynamics require vigilant credit risk management; disruption could materially impair sales continuity.
Regulatory Compliance Challenges and Product Development Risks
The company operates under strict NMPA oversight; noncompliance with Drug Administration Law standards risks production suspensions impacting output and profitability [S21]. Existing production lines meet Good Manufacturing Practice standards but future regulatory renewals remain uncertain amid evolving policies [S21][S26].
The Consistency Evaluation program poses operational challenges: failure can lead to product removal from hospital formularies or tenders causing sales declines or recall costs [S20].
Research and development expenses are minimal; recent efforts include technology transfer agreements such as one executed early 2026 for a patented compound aiming to broaden the portfolio beyond generics [S3][S13]. Nonetheless new product commercialization remains costly with low success rates typical for China's pharma pipeline [S12], limiting margin improvement prospects.
Liquidity Constraints and Capital Structure: Managing Solvency Concerns
Liquidity metrics highlight continued financial stress: as of December 31, 2025 current liabilities exceeded current assets by over threefold ($7.4 million vs $2.3 million), yielding a current ratio near 0.32 indicating weak short-term solvency coverage [F1]. These conditions raise substantial doubt about going concern status noted by management [S14].
The company maintains revolving credit facilities secured against production assets totaling RMB15 million (~$2+ million USD), with interest rates between approximately 3.25%-3.9%. These borrowings are personally guaranteed by the CEO who pledged personal collateral highlighting constrained access to traditional financing sources [S7][S10][S23].
Cash flow from operations improved markedly turning positive (+$148k) signaling initial success managing working capital through better receivables collection and cost containment measures including procurement consolidation and labor optimization as detailed recently [S14]. However full liquidity restoration remains challenging.
Growth Prospects and Strategic Initiatives: What the Company is Attempting
To counter revenue decline management executed a Technology Transfer Agreement early 2026 involving patented pharmaceutical compounds aimed at expanding beyond off-patent generics toward higher-margin products potentially less vulnerable to price pressure [S3]. Achieving regulatory approval remains critical but challenging given market dominance by larger competitors.
Acquisition opportunities have been limited due to market saturation within branded generics segments plus competition from better-capitalized firms restricting rapid scale expansion via M&A routes [S5].
If these initiatives align well with cost-cutting efforts—centralized manufacturing scheduling plus focused marketing spending—they could stabilize operations though execution risk remains high.
Capital Allocation Patterns: Returns, Investment, and Shareholder Value
Reflecting financial strain China Pharma does not pay dividends nor conduct share repurchases consistent with liquidity preservation priorities documented recently [F1][S18]. Capital expenditures remain tightly controlled around $59k annually versus historic peaks above $400k indicating cautious investment amid uncertain growth prospects [F1]. Free cash flow (operating cash flow minus capex) turned modestly positive (~$89k) underscoring tight cash deployment amid negative profitability compressing returns.
Equity capital increased significantly between FY2024-25 reflecting likely fresh capital contributions offsetting operational losses rather than earnings retention—this provides runway but ROE remains negative near -14% due to net losses eroding shareholder value despite some stabilization efforts [F1].
Key Metrics Snapshot: What Investors Should Monitor Next
Investors should watch:
- Renewal and expansion of distributor relationships given high sales concentration risks.
- Results of Consistency Evaluation tests impacting product eligibility for tenders.
- Progress on regulatory approvals for new patented products transferred via technology agreements.
- Quarterly operating cash flow trends alongside accounts receivable aging reflecting working capital management effectiveness.
- Impact of cost reduction initiatives on gross margins considering inventory impairment influences.
- Changes in credit facility terms or availability including any support beyond CEO personal guarantees clarifying solvency outlook.
While turnaround potential exists through expense control combined with selective portfolio upgrades the interplay between distributor dependence and regulatory compliance risks remain pronounced downside factors capable of rapid deterioration absent successful execution.
This analysis synthesizes public SEC filings as of April 2026 without investment advice. All quantitative data reflect officially disclosed figures without speculative extrapolation beyond stated periods.
Disclaimer: This is research-only, informational analysis and not investment advice. It may include AI-generated interpretation and general industry context. Always verify important details using primary sources.
Comments