
Caesarstone Ltd.’s Capital Strategy in a Market Characterized by Silicosis Litigation and Sales Weakness
An examination of Caesarstone’s falling revenues and escalating legal risks, highlighting implications for financial health and strategic priorities.
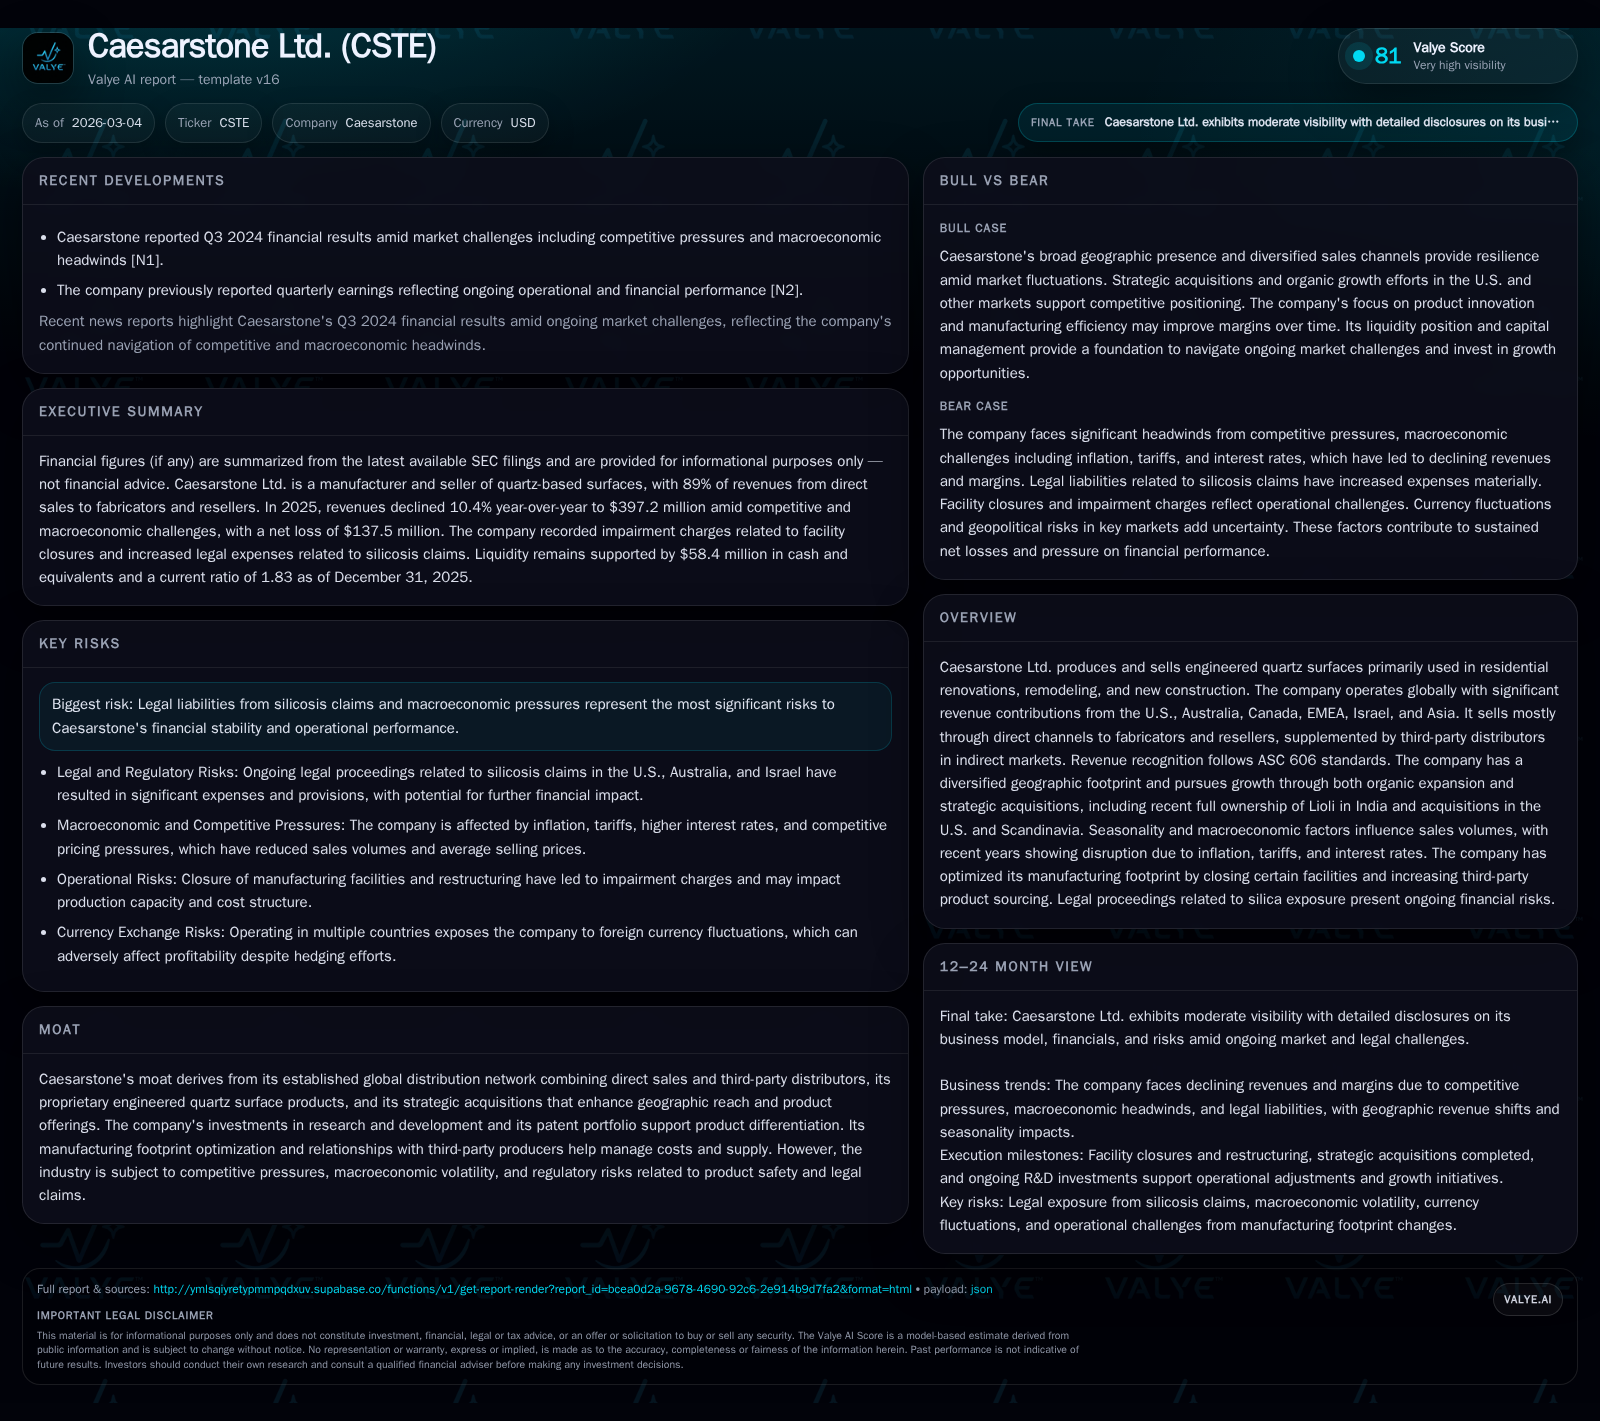
Caesarstone Ltd. has experienced significant revenue contraction and margin pressure through 2025, driven by macroeconomic headwinds, seasonal fluctuations, and ongoing silicosis litigation. Despite continuing to pursue growth via acquisitions and manufacturing optimization, the company faces negative operating cash flows and high legal provisions that strain liquidity. U.S. market opportunities remain pivotal but are tempered by cost inflation and regulatory uncertainties. Investors should monitor margins, litigation developments, and geographic revenue shifts for signals of operational stabilization.
Revenue Contraction and Margin Deterioration: A Look Back at Performance
From a high-water mark of $690.8 million in revenue in FY2022, Caesarstone’s top-line slid precipitously each year since, ending FY2025 at $397.2 million—a cumulative decline exceeding 40% over three years [F1]. The most recent fiscal year saw a 10.4% drop from the prior year’s $443.2 million.
Operating income has mirrored this deterioration but on an even more severe trajectory: dipping from an operating loss of -$58.7 million in 2022 to an astounding -$125.7 million last year [F1]. The net loss further deepened to -$137.5 million.
This sharp margin erosion stems largely from elevated manufacturing costs attributable to under-utilized capacity post-plant closures (notably Bar Lev), escalating logistics charges exacerbated by tariffs levied specifically on goods shipped into the sizeable U.S. market, and lower average selling prices amid growing competitive pressures [N1][S1][S20]. Consequently, gross margins compressed significantly from 21.8% in FY2024 down to only 18.4% in FY2025.
Operating cash flow swung from positive territory at approximately $31.9 million inflow in FY2024 to a notable outflow of -$38 million in FY2025 [F1]. Capital expenditures retreated modestly to just over $9 million as the company prioritized footprint optimization over expansion.
Historical performance (annual)
| FY | Rev ($mm) | Net ($mm) | CFO ($mm) | OpInc ($mm) | Rev YoY | Net YoY |
|---|---|---|---|---|---|---|
| 2025 | 397 | -137 | -38 | -126 | -10.4% | -220.9% |
| 2024 | 443 | -43 | 32 | -42 | -21.6% | +60.2% |
| 2023 | 565 | -108 | 67 | -88 | -18.2% | -88.7% |
| 2022 | 691 | -57 | -23 | -59 |
Source: SEC companyfacts cache [F1].
Capital returns and efficiency (annual)
| FY | Div ($mm) | FCF ($mm) | ROE% |
|---|---|---|---|
| 2025 | -47 | -98.7 | |
| 2024 | 0 | 21 | -15.8 |
| 2023 | 0 | 55 | -34.2 |
| 2022 | 9 | -41 | -13.6 |
Source: SEC companyfacts cache [F1].
Underlying Drivers: Seasonality, Market Dynamics, and Litigation Burdens
Seasonal effects prominently shape Caesarstone’s sales trajectory with traditionally stronger activity during the second and third quarters when northern hemisphere weather favors construction and renovation projects [S1][S17]. Conversely, first quarters are typically weaker due to winter slowdowns; Australian Q3 sales have been negatively impacted recently due to regulatory bans on quartz surfaces—all compounding demand headwinds [S1].
Inflationary cost pressures—especially raw materials like quartz which rose by approximately 22.5% in cost during FY2025—and increased tariffs targeting key markets such as the U.S., have intensified input cost volatility impacting both margins and pricing strategies [S10][N1].
Notably, Caesarstone recorded a considerable provision of $47.2 million for pending silicosis-related liabilities linked to respirable crystalline silica dust exposure among fabricators & employees across Israel, the U.S., and Australia [S1][S5][S12]. This reserve underscores the materiality of ongoing litigation risk which directly threatens liquidity through potential damages payouts.
Geographic Mix and Distribution Channels: Impact on Sales Trends
The company derives nearly half its revenues from the United States (47%), making it its largest geographic market followed by Australia (17%), Canada (13%), EMEA (13%), Asia (4.6%), and Israel (4.9%) [S4][S8][S20].
Caesarstone operates a predominant direct sales model accounting for approximately 89% of revenues wherein it sells mostly to fabricators and resellers—a key industry channel that demands reliable supply continuity given long lead times averaging between 20-100 days [S4][S8].
This fabricator-focused direct sales consumption model is critical for securing end-user customer loads but requires sophisticated inventory planning as shipping delays can stress working capital management [S1]. In indirect markets where third-party distributors operate predominantly, Caesarstone extends limited defect warranties, passing downstream warranty responsibilities further along the distribution chain [S4].
Capital Deployment: Acquisitions and Manufacturing Optimization Efforts
Caesarstone pursues a dual-pronged growth strategy combining organic expansion with opportunistic strategic acquisitions aimed at broadening geographic reach or product portfolio differentiation [S1][S20]. Recent notable deals include:
- Consolidation of Lioli in India (porcelain slab manufacturer), achieving full ownership in fiscal year 2025;
- Acquisition of Omicron, a regional U.S.-based stone supplier operating multiple locations across Florida, Ohio, Michigan, Louisiana;
- Addition of Caesarstone Scandinavia distributor acquired in 2022.
Alongside these investments, Caesarstone undertook rationalization efforts closing Richmond Hill (USA) facilities earlier plus Bar Lev plant closures reducing fixed cost burdens while maintaining production resiliency via third-party production bases (PBPs) thereby increasing proportion sourced externally [S1][S22].
Capital expenditures reflected these trends: decreasing modestly over three years from $17.8M in FY2022 down to just over $9M in FY2025 focused more on maintenance and moderate expansions rather than aggressive capacity buildup [F1][S13].
Financial Health Snapshot: Liquidity, Debt Obligations, and Cash Flow Challenges
The operating environment strained Caesarstone’s liquidity evidenced by negative operating cash flow (-$38M) versus positive $31.9M just one year earlier [F1]. Working capital improvements partially offset losses but remain insufficient against net losses exceeding $137M in FY2025.
Lease obligations form a large component of fixed commitments totaling approximately $133 million payable over various maturities with near-term payments around $30 million within twelve months [S3]. The company held minimal bank debt ($2.4M principal), with interest payments totaling about $0.2M within twelve months [F1][S9].
Despite weakened financial metrics—including a reduction in equity from $421M in FY2022 to $139M in FY2025—the company suspended dividend payments since at least FY2023 signaling capital preservation focus amid elevated risk conditions [F1].
Legal Risks from Silicosis Claims: Potential Impact on Financial Stability
Silicosis litigation represents a conspicuous overhang for Caesarstone’s outlook with formal provisions set aside carrying a book value of $47.2 million reflecting probable & estimable exposure primarily stemming from employee health claims related to engineered quartz dust inhalation across jurisdictions including Israel (headquarters), Australia (ban impact), and the U.S.[S12][N1][S24]
These bodily injury claims are subject to ongoing regulatory scrutiny while insurance coverage availability remains uncertain—potentially leading to material cash outflows during unfavorable resolution scenarios.[S12] The overlay of such contingent liabilities complicates forecasting stabilized cash flows or reinvestment capacity.
Growth Prospects: Organic Expansion versus Macroeconomic Constraints
Caesarstone views the sizable U.S residential renovations segment as fertile ground for future growth given population trends favoring remodeling demand though macroeconomic factors impose constraints.[N1][S20]
Rising interest rates curtail home financing activity while inflation dampens discretionary spend impacting renovation timelines and scope which directly hits volumes.[N1] Meanwhile tariff escalation pressures raise costs that challenge price competitiveness without eroding buyer loyalty.
On the innovation front,R&D spending increased modestly reaching $5.7 million emphasizing development around zero crystalline silica products—aimed at addressing health risk concerns—a necessary pivot for long-term viability amid litigation landscape.[S13]
Acquisition integrations provide avenues for extending footprint though integration challenges manifest as short-term cost centers sometimes delaying profitability rebound.[N1]
Investor Watchpoints: What to Expect from Upcoming Quarters and Strategic Milestones
While explicit forward guidance is unavailable in current filings,[N1] several key KPIs merit attention:
- Margin recovery efforts tied to improved capacity utilization post manufacturing footprint closures;
- Monitoring changes or reductions in litigation reserves or settlement announcements impacting cash flow;
- Geographic revenue mix shifts especially renewed traction in core markets like Australia post regulatory relaxations or Israel post-conflict stabilization;
- Effective working capital management balancing extended shipping cycles amidst volatile end-demand;
- Progress on bringing zero crystalline silica or alternative safer materials into commercial scale production impacting competitive positioning.
Operational leverage realization alongside balancing legal contingencies will be critical metrics shaping medium-term performance narrative.
Disclaimer: This is research-only, informational analysis and not investment advice. It may include AI-generated interpretation and general industry context. Always verify important details using primary sources.
Comments