
Carvana’s Integrated E-Commerce Strategy Drives Retail Sales Growth and Margin Stability
Carvana leverages its vertically integrated platform and logistics network to expand used vehicle retail sales amidst evolving operational challenges and capital structure dynamics.
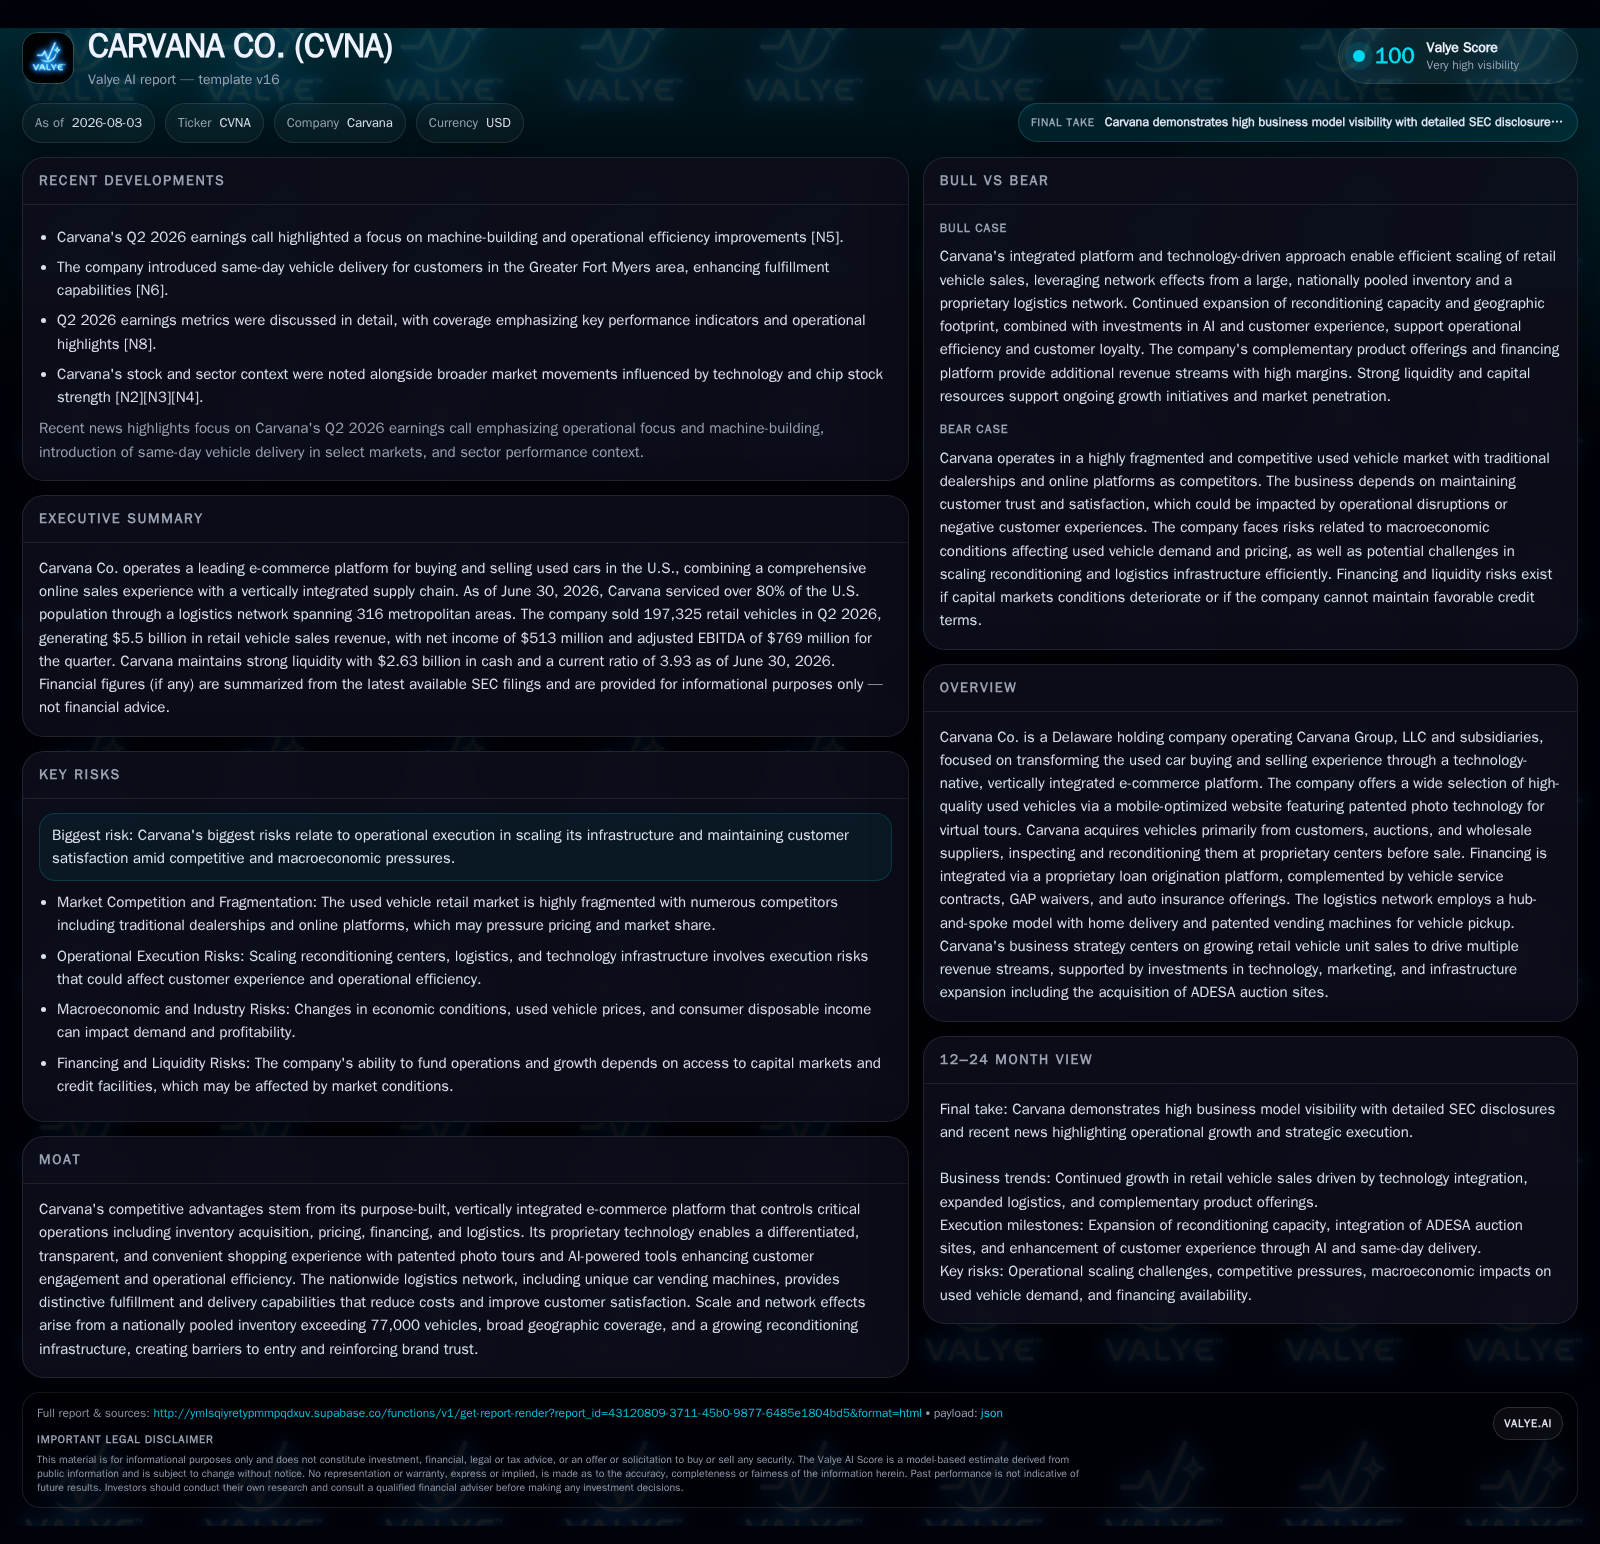
Carvana Co.’s latest quarterly results highlight continued growth in retail vehicle sales and an expanding customer base supported by a scalable e-commerce platform. Its vertically integrated supply chain—including proprietary acquisition channels, inspection and reconditioning centers, and a logistics network featuring unique vehicle vending machines—underpins strong total gross profit per unit despite some margin pressure. The company’s financing platform and complementary products enhance revenue streams, while disciplined capital management maintains liquidity despite capital-intensive inventory needs. Key risks include operational execution in scaling infrastructure and macroeconomic headwinds impacting vehicle demand and credit quality.
Recent Operating Update: Scaling Sales with Margin Discipline
Carvana's second quarter of fiscal 2026 showcased a significant expansion in retail vehicle unit sales to 197,325, up sharply from 143,280 units in Q2 2025. This near 38% increase propelled total revenues to $7.38 billion for the quarter [S9][S19], marking sustained consumer traction for its e-commerce proposition amid an evolving automotive retail environment. The rise in unit volume was supported by growth in direct-to-customer inventory sourcing via trade-ins and enhanced auction platforms.
The company maintained total gross profit per retail unit at roughly $7,014—a modest decline compared with the prior year attributable partly to competitive pricing pressures and changing mix—but offset by increases in gross profits from financing gains and complementary services such as vehicle service contracts (VSCs) and GAP waivers which bear 100% gross margins [S17][S21]. Cost control is reflected in a reduction of SG&A expenses per retail unit to $3,568 from $3,846 year-over-year, signaling improved operating leverage through continued investments in technology-driven marketing efficiencies and logistics optimization [S9].
Liquidity remains robust with cash balances totaling approximately $2.63 billion alongside revolving credit facilities providing over $2 billion in borrowing capacity; total committed liquidity resources stand near $7 billion as of June 30, 2026 [F1][S6], affording considerable runway to fund working capital needs against a capital-intensive inventory model.
Business Model: Vertically Integrated E-Commerce with Complementary Financial Products
Carvana operates as a technology-native used car retailer positioned uniquely within the automotive value chain by integrating inventory acquisition, pricing, inspection/reconditioning, financing, selling, and last-mile delivery [S1][S2]. Its vehicle inventory is sourced directly from customers trading in or selling vehicles—removing intermediary fees—supplemented by procurement at traditional auctions and wholesale suppliers facilitated by its growing digital auction platform
The next critical step is the detailed inspection and reconditioning process executed at proprietary Inspection and Reconditioning Centers (IRCs) equipped with advanced technological systems to ensure uniform cosmetic standards across over two dozen sites nationwide. Vehicles failing quality benchmarks transition into wholesale channels leveraging its marketplace platform or external auction houses [S1].
Online shopping occurs through a mobile-optimized platform that supports deep research tools including patented photo tours allowing virtual walkarounds—a differentiation intended to provide transparency fostering consumer trust without showroom visits or high-pressure salesmanship [S1][N3]. A proprietary AI-powered loan origination engine evaluates risk using over ten years of internal data to optimize credit decisions dynamically—this facilitates enhanced securitization opportunities driving incremental lending profits beyond the core transaction margin from vehicle sale itself [S1][S21].
Complementary product offerings such as VSCs augment monetization while also offering customers peace of mind; these services contribute fully to gross profit given their negligible direct costs [S17]. The logistics network employs innovative delivery options including patented vehicle vending machines across major metros enabling convenient pickup or delivery with reduced personnel costs relative to traditional dealership footprint models.
Industry Structure and Competitive Positioning
The used automotive retail sector remains fragmented with e-commerce adoption behind other segments but is showing rapid acceleration due to consumer shifts favoring online purchasing for large durable goods. Carvana competes against legacy omnichannel operators like CarMax that blend physical presence with online capabilities. Pure-play digital competitors such as Vroom or Shift focus similarly on e-commerce but often rely more heavily on third-party logistics or lack Carvana’s degree of vertical integration.
Wholesale auction platforms like Manheim serve as suppliers but also represent indirect competitors given Carvana's growing proprietary digital auction capabilities. Financing specialists focusing solely on auto loans contrast with Carvana's integrated approach combining vehicle sale with proprietary loan originations that enable cross-product bundling advantages.
Carvana’s scale—exceeding three million retail vehicles sold since inception—and geographic penetration covering over 80% of the U.S. population underpin network effects that expand inventory depth while enhancing delivery efficiency via hub-and-spoke logistics enhancements. These factors create barriers for smaller entrants struggling to match its operational breadth or capital intensity required for expansive IRC networks.
Growth Drivers: Technology-Fueled Convenience Meets Expanding Market Acceptance
Key drivers fueling Carvana’s growth trajectory involve ramping consumer confidence in buying high-value vehicles online supported by seamless digital workflows reducing friction points like negotiation or dealership visits. Enhancements to AI underwriting lower customer acquisition friction while improving loan portfolio quality—crucial given credit risk sensitivity in subprime segments.
Geographic expansion through new vending machine installations coupled with same-day local delivery pilots (e.g., Fort Myers introduction reported recently) enhance customer experience by reducing fulfillment lead times which historically constrained online auto retailing scalability [N13]. Complementary product cross-selling improves revenue per transaction providing higher lifetime value per customer.
Rising demand for used vehicles driven by new car supply constraints sustains volume opportunities; meanwhile internal improvements targeting reconditioning cycle efficiency aim to drive faster inventory turnover thus optimizing working capital deployment.
Risks & Watchpoints: Execution Complexity Amid Market Dynamics
Despite encouraging volumes, Carvana faces distinct operational scaling risks inherent in maintaining consistent quality controls across IRCs while managing tight delivery timelines through an intricate logistics network prone to disruptions. Customer satisfaction remains fundamental given relatively low switching costs; elevated return rates or post-sale issues could erode brand trust rapidly [S1][N4].
Macroeconomic headwinds including inflationary pressures on fuel/pricing inputs or potential used car price corrections could impact margin resilience despite volume gains. Financing operations expose Carvana to credit losses exacerbated during downturns; although AI underwriting provides data-driven mitigating mechanisms its effectiveness will require verification through economic cycles.
What to Watch Next: Indicators of Sustainable Profitability & Operational Scalability
Investors should track sequential changes in gross profit per unit alongside shifts in SG&A efficiency metrics to gauge operating leverage improvements. Monitoring loan origination volumes versus default trends will provide insight into financing segment health.
Expansion rate of vending machines and same-day delivery rollout pace serve as tangible proxies for fulfillment innovation success impacting customer satisfaction scores. Wholesale marketplace activity volume may also reveal inventory optimization strategies balancing retails versus asset-light wholesale sales.
Subsequent quarterly guidance or management commentary on capex plans for IRC expansions or technology investments will clarify the long-term scalability prospects relative to growth ambitions.
Financial Profile Discussion
Carvana closed Q2 2026 with approximately $2.63 billion in cash and equivalents and current assets of $8.0 billion against current liabilities of $2.04 billion, resulting in a current ratio near 3.93 as of June 30, 2026 [F1]. This robust liquidity supports ongoing purchase commitments for vehicles alongside operating expenses tied to logistic fleet maintenance and technology spend.
Total debt figures are not explicitly updated in the latest filings; however, the company maintains a net cash position supported by strong cash balances relative to liabilities [F1]. Interest expense declined sequentially versus prior periods reflecting refinancing efforts or debt paydowns contributing positively toward profitability margins [S19][S17].
Capital expenditure outlays increased modestly driven primarily by property improvements at IRCs and investments related to franchise dealership acquisitions noted recently—even as the firm maintains disciplined capex deployment focused on scalable returns rather than aggressive footprint expansion alone [S16]. Cash flow from operations improved alongside top-line growth providing reinvestment capacity without excessive reliance on new equity issuances or incremental debt funding.
This analysis relies solely on regulatory filings filed through July 29, 2026 ([S1],[S2],[S3],[F1]) complemented by recent market commentary ([N3],[N4],[N13]) contextualizing Carvana's operating performance within the broader used car e-commerce industry dynamics. It avoids unsupported extrapolations focusing strictly on documented operating metrics and financial disclosures without investment research views.
Disclaimer: This is research-only, informational analysis and not investment advice. It may include AI-generated interpretation and general industry context. Always verify important details using primary sources.

Comments