
Educational Development's Capital Strategy Highlights Asset-Backed Liquidity Amid Profit Challenges
Recent quarterly disclosures underscore the company’s reliance on real estate-backed liquidity to counter ongoing operating losses.
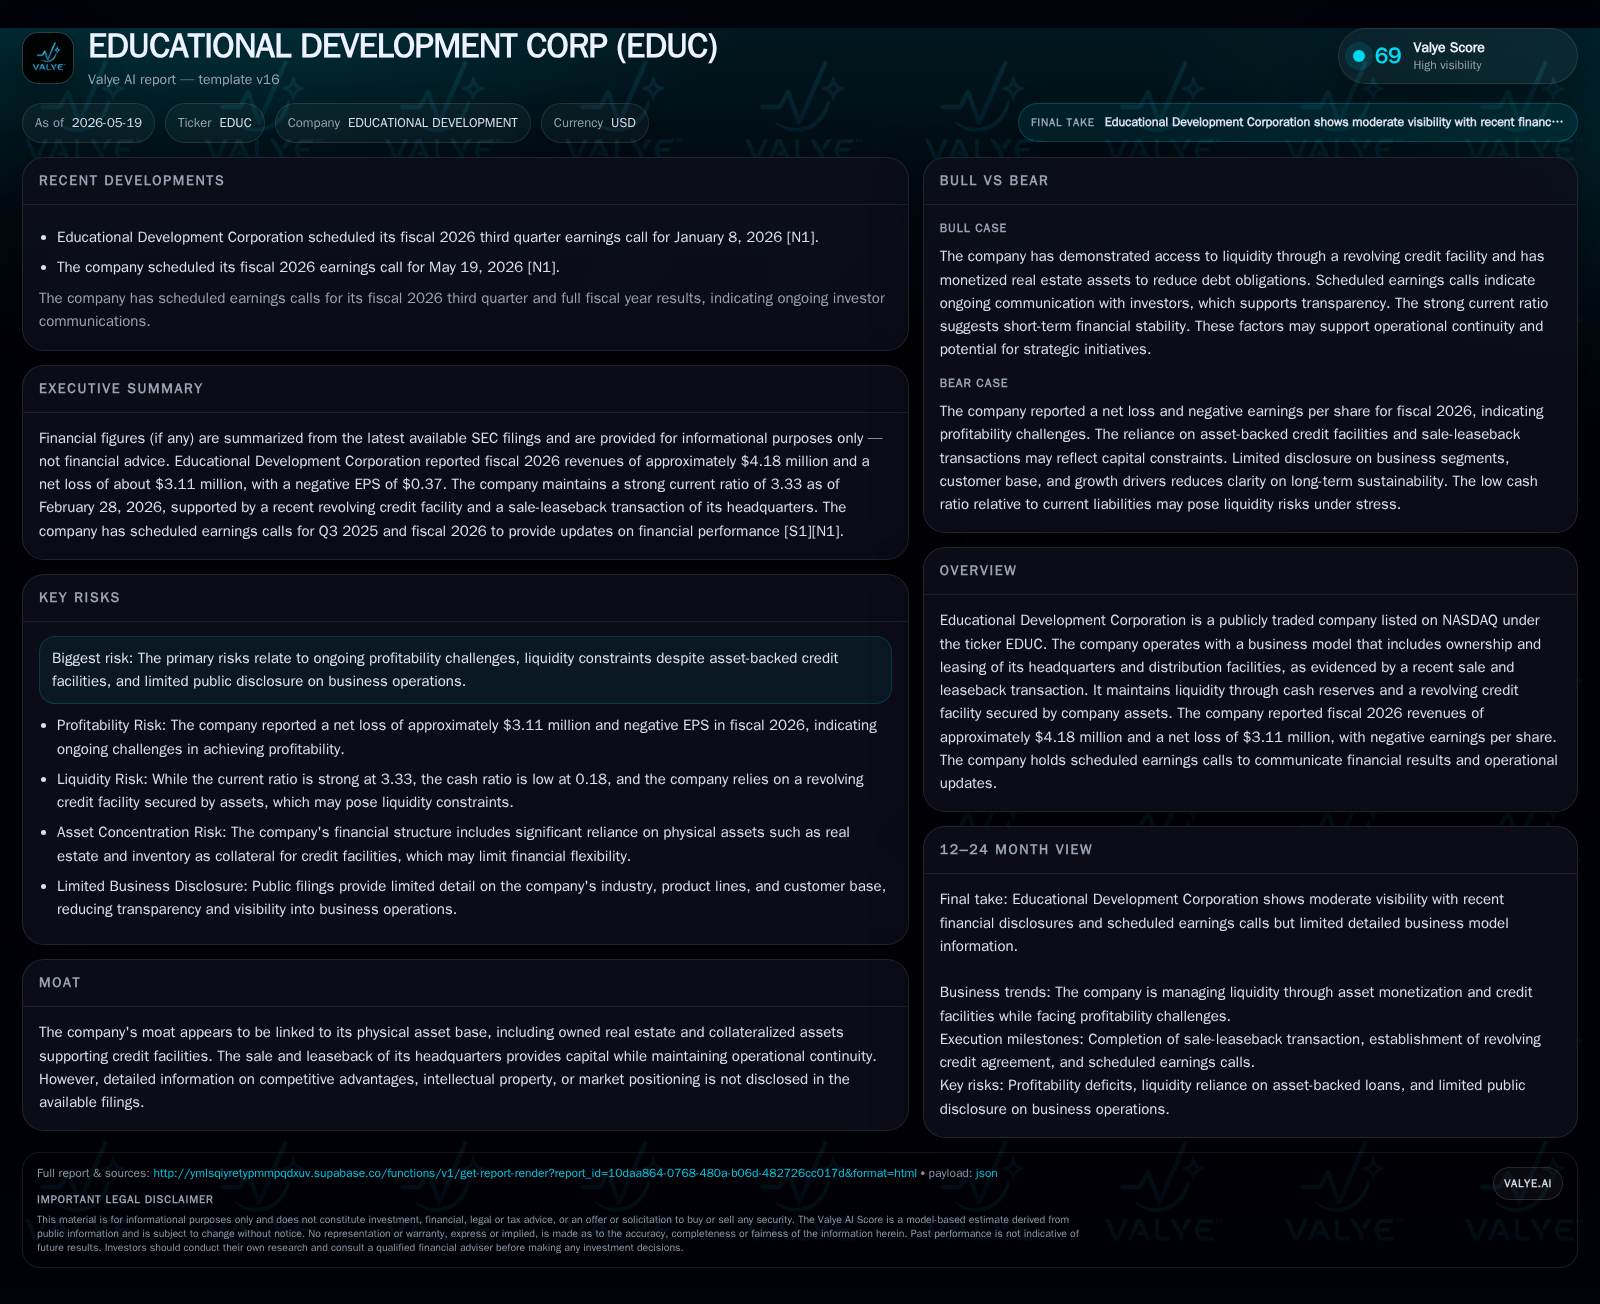
Educational Development Corporation’s latest 10-Q filing reveals strategic maneuvers in liquidity management anchored by a sale-leaseback transaction on its headquarters, offsetting continuing net losses. The business generates revenue primarily through distribution of educational materials supported by owned physical assets that reduce leasing costs. Competitive pressures and constrained profitability are persistent challenges, while maintaining a strong current ratio and zero debt provides some financial stability. Future focus centers on operational execution and potential market expansion amid tight margins.
Recent Operating Developments: 10-Q Insights
Educational Development Corporation’s latest quarterly filing for the period ended November 30, 2025 [S2] highlights crucial operational and financial positioning during ongoing challenges. Most notably, the company executed a sale-leaseback transaction involving its headquarters facility, a move designed to bolster liquidity while preserving operational continuity. This transaction underscores the firm’s reliance on physical asset monetization as a capital strategy during periods of sustained net losses. Revenue continues to hover near $4.18 million for fiscal 2026, yet net income remains negative at approximately $3.11 million, reflecting sustained pressure on profitability.
Additionally, the reporting confirms compliance with SEC electronic submission requirements, demonstrating governance discipline despite financial headwinds.
Business Model and Revenue Streams: Asset Ownership and Distribution
Educational Development operates primarily as a distributor of educational materials—a niche requiring effective inventory management, stable supply-chain relationships, and customer base continuity. Revenue generation stems from direct sales to schools, libraries, or educational retailers seeking specialized content products [S1]. A distinguishing feature is the company's strategic ownership of key real estate assets including its headquarters and distribution facilities
This asset ownership reduces long-term fixed costs associated with leasing high-value space—translating into margin advantages in an otherwise low-margin segment vulnerable to volume fluctuations and seasonal demand cycles. However, operating losses indicate that this cost advantage alone has not sufficed to drive profitability.
Customer purchase behaviors likely exhibit elastic sensitivity tied to budget cycles in education sectors; contract structures and repeat purchasing patterns influence volume but remain unspecified in filings.
Competitive Context and Industry Structure
While detailed competitor data is scarce, the broader industry context suggests Educational Development faces headwinds typical of educational content distributors. Pricing pressure emerges from digital substitution trends and competitive pricing among peers offering overlapping product lines.
Switching costs for institutional customers may be moderate—customer loyalty often linked to product breadth, reliability of delivery, and pricing consistency rather than proprietary content exclusivity.
Supply chain variables potentially include manufacturing lead times for printed materials versus digital formats, warehouse logistics efficiency, and distribution channel access—all factors impacting timely fulfillment and cost structure [S1], [S2].
Regulatory constraints are minimal but budgetary limitations for public education customers can sharply impact ordering patterns.
Strategic Use of Real Estate Assets in Liquidity Management
A defining element of Educational Development’s strategy is the monetization of real estate holdings to enhance liquidity without disrupting operations [S1], [S3], [F1]. The recent sale-leaseback deal converts owned property into cash inflow while maintaining occupancy through leasing arrangements—preserving productive capacity while alleviating immediate capital constraints.
Complementing this is access to an asset-backed revolving credit facility secured by company-owned properties—providing flexible borrowing capacity if needed.
This approach reinforces the firm's "moat" predominantly as a function of tangible asset collateral rather than intangible competitive advantages like intellectual property or brand strength.
Such asset-backed strategies mitigate refinancing risks but do not address underlying operating inefficiencies driving recurring losses.
Growth Catalysts and Expansion Opportunities
Growth prospects hinge on deeper penetration within existing educational markets or potential diversification through digital platform enhancements or new product introductions hinted at in recent disclosures [S1], [S3].
The current asset base could support incremental capacity expansion without significant additional fixed costs—allowing scalable deployment if demand improves.
Key performance indicators anchoring growth include order backlog volumes, renewal rates among institutional clients, pricing leverage on new contracts, and digital sales contribution—though explicit metrics are not publicly detailed.
Market expansion may require sharpening value propositions in increasingly digital educational environments where print-based product relevance must evolve.
Risks and Constraints Affecting Profitability and Execution
Primary risks derive from ongoing unprofitability and limited clarity on reversing this trend amid evolving industry conditions [S1], [S2].
Potential constraints include dependence on physical asset monetization which may have diminishing returns over time, customer concentration risk if few large buyers dominate orders, and modest switching costs that could expose revenue volatility.
Transparency gaps in business strategy earn mention as an investor watchpoint given scant disclosure on competitive positioning or concrete operational initiatives beyond financing moves.
Regulatory or budgetary variabilities within education markets add further uncertainty to demand projections.
Upcoming Milestones and Market Signals to Monitor
Investors should track forthcoming quarterly earnings calls as scheduled by the company [N1], which serve as key forums for updated financial guidance, demand forecasts, and operational progress reports.
Lease agreement renewals related to the sale-leaseback transaction will signal potential shifts in occupancy costs impacting future margins.
Liquidity developments including draws under the revolving credit facility or new asset sales could affect balance sheet flexibility.
Any announcements around product launches or digital adoption initiatives would be relevant indicators of strategic growth execution.
Financial Overview: Liquidity Standing and Profitability Snapshot
From a financial standpoint [F1], Educational Development reported fiscal year 2026 revenues of approximately $4.18 million coupled with a net loss approaching $3.11 million—highlighting entrenched challenges turning top-line into positive net results. Cash and equivalents stood near $1.12 million at fiscal year-end against zero recorded total debt, resulting in a net cash position that supports short-term obligations.
Overall, while Educational Development maintains enviable balance sheet metrics for liquidity relative to peers with similar scale, the critical hurdle remains translating these financial resources into profitable growth without further erosion of capital reserves.
Disclaimer: This analysis is based solely on disclosed public filings and data prevailing as of May 19, 2026; it aims to provide an informed commentary without investment advice or speculative forecasts.
Disclaimer: This is research-only, informational analysis and not investment advice. It may include AI-generated interpretation and general industry context. Always verify important details using primary sources.

Comments