
Enterprise Financial Services Corp Balances Portfolio Diversification with Rising Credit Risks
EFSC’s diversified lending and geographic footprint support steady profit growth despite increased nonperforming loans and integration costs.
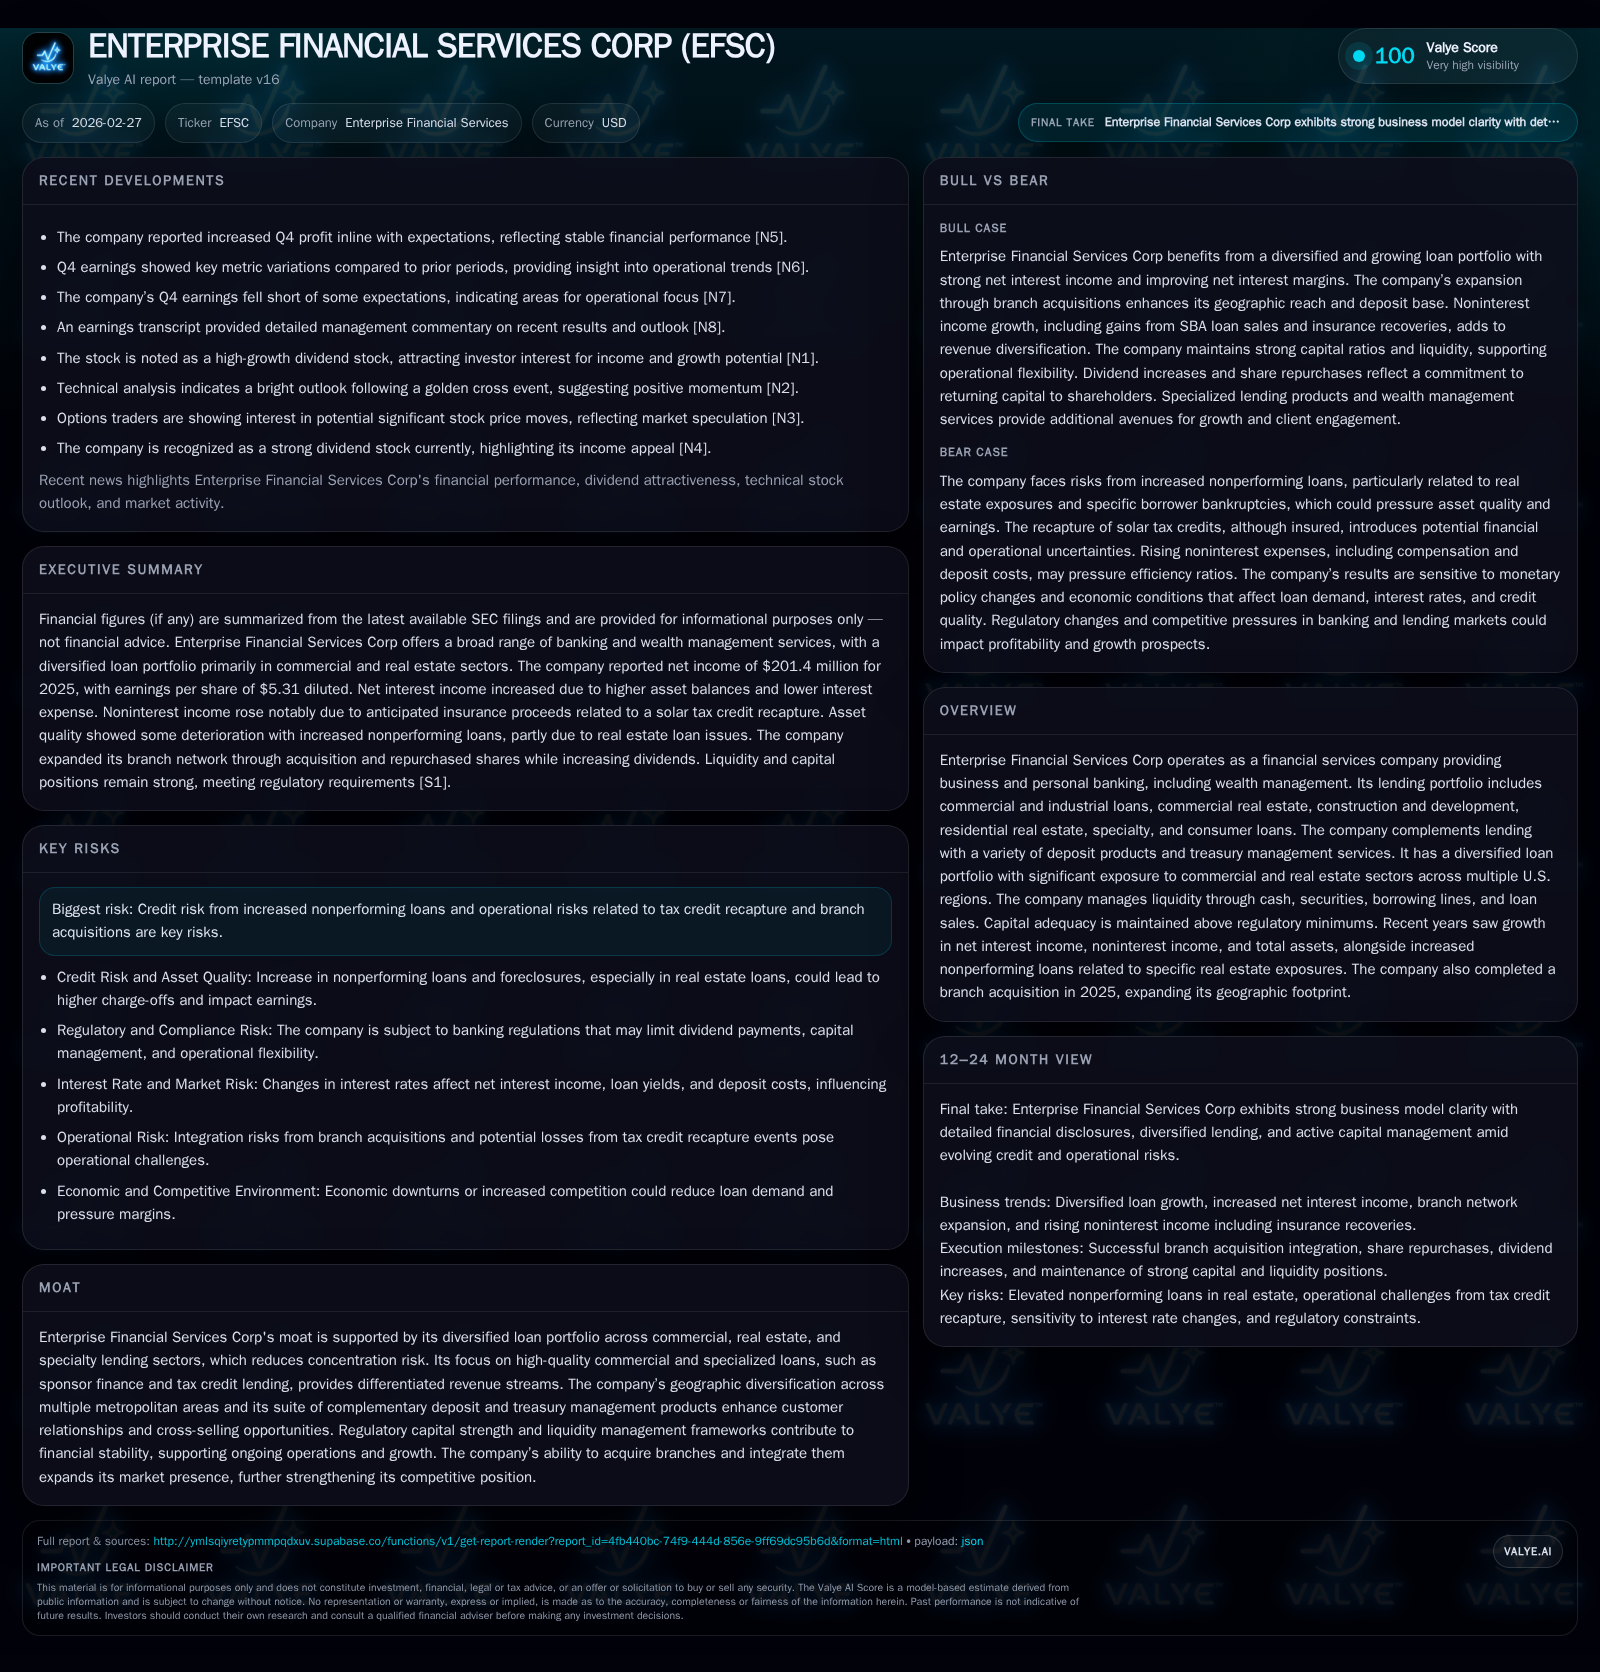
Enterprise Financial Services Corp (EFSC) has demonstrated continued top-line and net income growth through 2025, driven by broad-based loan portfolio expansion, deposit growth, and strategic branch acquisitions. The company’s specialized lending segments such as sponsor finance and tax credit-related loans augment revenue diversity, while geographic diversification across multiple U.S. metro areas mitigates concentration risks. However, rising nonperforming loans primarily linked to specific real estate exposures and operational expenses from recent branch acquisitions impose caution. EFSC maintains strong capital ratios well above regulatory minimums, supports shareholder returns via dividends and share repurchases, and employs active liquidity management anchored by a substantial securities portfolio.
Historical Performance
Enterprise Financial Services Corp has shown consistent financial growth over the past four years leading to 2025 [F1]. Net income reached $201.4 million in FY2025—an increase of approximately 8.7% year-over-year from $185.3 million in FY2024. This was supported by an expanding balance sheet: total assets grew almost 11% in 2025, fueled by loan growth (+5%) and increased securities holdings (+34%) which improved liquidity profiles [S24][S38][S7].
Deposits have been a major driver of funding expansion with organic increases complemented by the company's branch acquisition adding about $609 million in deposits during the year [S25]. Total deposits rose by over $1.4 billion (11%) in 2025 to $14.6 billion [S24], reflecting strength in both interest-bearing and noninterest-bearing accounts.
Historical performance (annual)
| FY | Net ($mm) | CFO ($mm) | Capex ($mm) | Net YoY |
|---|---|---|---|---|
| 2025 | 201 | 194 | 12 | +8.7% |
| 2024 | 185 | 247 | 7 | -4.5% |
| 2023 | 194 | 268 | 7 | -4.4% |
| 2022 | 203 | 217 | 2 |
Source: SEC companyfacts cache [F1].
Capital returns and efficiency (annual)
| FY | Div ($mm) | Buybacks ($mm) | FCF ($mm) |
|---|---|---|---|
| 2025 | 45 | 14 | 182 |
| 2024 | 40 | 30 | 240 |
| 2023 | 37 | 0 | 262 |
| 2022 | 34 | 33 | 215 |
Source: SEC companyfacts cache [F1].
The table highlights key financial trends demonstrating steady earnings supported by solid operating cash flows despite fluctuations partly due to working capital timing effects.
Business Mix and Portfolio Composition
EFSC’s core competitive advantage stems from a broadly diversified lending portfolio [S13][S16]. As of December 31, 2025, the total loan book stood at roughly $11.8 billion [S12], distributed mainly among:
- Commercial & Industrial (C&I): ~44%
- Commercial Real Estate (CRE): ~47% combining investor-owned (25%) and owner-occupied (21%)
- Construction & Land Development: ~6%
- Residential Real Estate: ~3%
- Consumer Loans: Less than 1%, after reclassification adjustments [S13][S12]
Within C&I loans, specialized segments such as sponsor finance targeting manufacturing, wholesale trade, mid-market private equity-backed companies; life insurance premium financing tied to high-net-worth estate planning; and tax credit lending contribute differentiated revenue streams beyond traditional banking products [S15].
Geographically, EFSC maintains exposure across multiple U.S metro statistical areas including St Louis (MO-IL), Los Angeles-Long Beach-Santa Ana (CA), Phoenix-Mesa-Chandler (AZ), Kansas City (MO-KS), San Diego-Carlsbad-San Marcos (CA), Dallas-Fort Worth-Arlington (TX), Albuquerque (NM), Santa Fe (NM), Las Vegas-Paradise (NV), Tucson-Nogales (AZ) alongside other smaller markets [S13]. This spread mitigates geographically concentrated economic risks inherent in sector lending.
The recent branch acquisition added deposits totaling nearly $609 million and approximately $292 million in loans primarily commercial focused across Arizona and Kansas City regions [S25].
Credit Risk Considerations
While the Company exercises disciplined underwriting practices—assessing borrower cash flows beyond collateral values for C&I loans and requiring guarantors for CRE deals—credit risk has heightened with increased nonperforming loans related primarily to selected real estate exposures [N1][N9][S1]. Stress testing under various economic scenarios are routinely conducted including vacancy rates, rental price shifts, and interest rate fluctuations [S16].
A notable event impacting credit was a solar tax credit recapture incident where a bankrupt solar provider’s restructuring led to recaptured credits impacting prior taxable periods; the Company anticipates insurance proceeds mitigating this impact totaling approximately $32 million [S20].
Management monitors credit quality via allowances for credit losses segmented by pools with similar risk characteristics supplemented by individual loan evaluations as needed [S19]. Allowance levels adjust dynamically based on internal loss history plus macroeconomic forecasts incorporating GDP changes, unemployment rates, and real estate valuations.
Revenue Trends and Margin Dynamics
Net interest income increased due mainly to organic asset growth plus cost-efficient deposit funding post branch acquisition [S21][S22]. The company’s net interest margin modestly improved owing chiefly to lower cost of funds following Federal Reserve rate cuts since late-2024 [S22]. Variable rate loans comprise about 60% of the portfolio with approximately two-thirds subject to floors mitigating downside margin erosion; derivative contracts totaling $400 million notional provide hedge protection against rate volatility effects on floating-rate assets [S17][S18].
Noninterest income surged sharply (+62%) largely because of anticipated insurance recovery from the solar tax credit recapture event along with elevated gains on SBA loan sales, Bank-Owned Life Insurance income enhancements, and other operating gains [S20]. Wealth management revenues remained stable while card services revenues held steady.
These factors supported healthy pre-provision net revenue generation exceeding prior years.
Expenses and Operating Leverage
Noninterest expense increased about 12% due to multiple factors including:
- Compensation costs rise driven by merit increases, headcount growth—including integrating new associates from branch acquisitions,
- Higher deposit-related expenses due to expanded deposit verticals where clients receive earnings credit allowances,
- Costs associated directly with acquired branches totaling approximately $3.7 million,
- Increased professional fees reflecting advisory support for ongoing operational initiatives [S20][N3].
Despite elevated overheads from scale-up activities post-acquisition efforts, efficiency ratios improved slightly thanks to revenue gains outpacing expense growth.
Capital Structure & Liquidity Profile
EFSC maintains strong capitalization metrics significantly above regulatory 'well-capitalized' thresholds with:
- CET1 Capital Ratio near 11.6%
- Tier One Capital Ratio approximating 12.8%
- Total Risk-Based Capital Ratio around14%
- Leverage ratio exceeding twice the regulatory minimums at roughly10.5% [S8]
The company refinanced subordinated debt reducing interest costs: redeemed fixed-rate subordinated debentures bearing nearly10% fixed coupon replacing them with senior notes indexed to Term SOFR plus moderate spreads (~2.5%) enhancing funding cost efficiency [S9].
On liquidity management front, EFSC relies on diversified sources including:
- Strong cash reserves at ~$682 million as of YE2025,
- Investment securities portfolio totaling $3.7 billion with ~$2 billion unencumbered for potential pledging or sale,
- Borrowing capacity via Federal Home Loan Bank (
$1.6 billion) and Federal Reserve facilities ($3 billion), - Multiple correspondent bank lines aggregating over $135 million,
- Secondary market sales of SBA guaranteed loans augmenting near-term liquidity, [S6][S7]
Loan commitments outstanding were significant (~$3 billion), though their utilization risk is mitigated given low simultaneous drawdown probability.[S4]
Shareholder Returns & Capital Allocation
The company distributed $45 million in common stock dividends during FY2025 up from prior years reflecting earnings growth albeit regulatory capital requirements remain primary dividend-declaring considerations [S10][F1]. Share repurchases continued but at a reduced pace ($14 million vs nearly $30 million previously) reflecting cautious capital deployment balancing organic growth initiatives plus integration expenses related to acquisitions.
ROE approximates just under10% based on reported net income against average equity—a respectable return given prevailing mid-sized regional bank performance benchmarks [F1]. Operating cash flow remains robust supporting internal funding needs even as free cash flow after capex remains strong (~$181 million).
Forward-Looking Considerations & Risks
The company's future trajectory hinges upon:
- Managing incremental credit risks associated with commercial real estate concentrations amid evolving economic conditions,
- Successful realization of synergies from branch acquisitions without material integration disruptions,
- Maintaining capital adequacy considering potential future regulatory changes or economic downturn impacts,
- Navigating possible tax or operational contingencies stemming from complex specialty loan portfolios including tax-credit funded projects.
Monitoring quarterly updates on asset quality metrics such as nonperforming loan levels particularly within construction-related portfolios will be critical.[N1][N9][S1]
Liquidity position relative to large unfunded commitments warrants attention especially if adverse macroeconomic conditions simultaneously depress repayment cycles.[S4]
Interest rate policy shifts could affect net interest margin variability notwithstanding hedging strategies.[S17]
Conclusion
Enterprise Financial Services Corp's strategy leveraging diversified loan portfolios enhanced by specialty credit lines like sponsor finance and tax credits bolsters revenue streams beyond conventional banking activities. Geographic diversification across multiple U.S hubs tempers localized downturn risks while disciplined capital management ensures regulatory compliance plus shareholder return capability.
Credit quality deterioration tied mainly to select real estate exposure segments introduces a layer of vulnerability that management seeks to mitigate through stringent underwriting standards accompanied by proactive monitoring systems.[S16] Operational expenditures reflect deliberate investment into personnel expansion concurrent with branch acquisitions intended to enhance market outreach. The company exhibits prudent use of liquidity sources balancing immediate operational funding needs against longer-term strategic deployments.[S6] While external uncertainties remain inherent—particularly economic headwinds impacting loan performance—the company’s strong capitalization combined with its broad funding base anchors financial stability moving forward. Customers benefit from integrated treasury solutions complementing lending relationships reinforcing an entrenched competitive position within regional banking.
Disclaimer: This report is for informational purposes only and does not constitute investment advice or recommendations regarding any securities mentioned herein.
Disclaimer: This is research-only, informational analysis and not investment advice. It may include AI-generated interpretation and general industry context. Always verify important details using primary sources.

Comments