
Finward Bancorp’s Earnings and Regulatory Recovery Shape 2025 Performance
Finward Bancorp navigated post-consent order regulatory relief alongside loan portfolio shifts and capital management challenges in 2025.
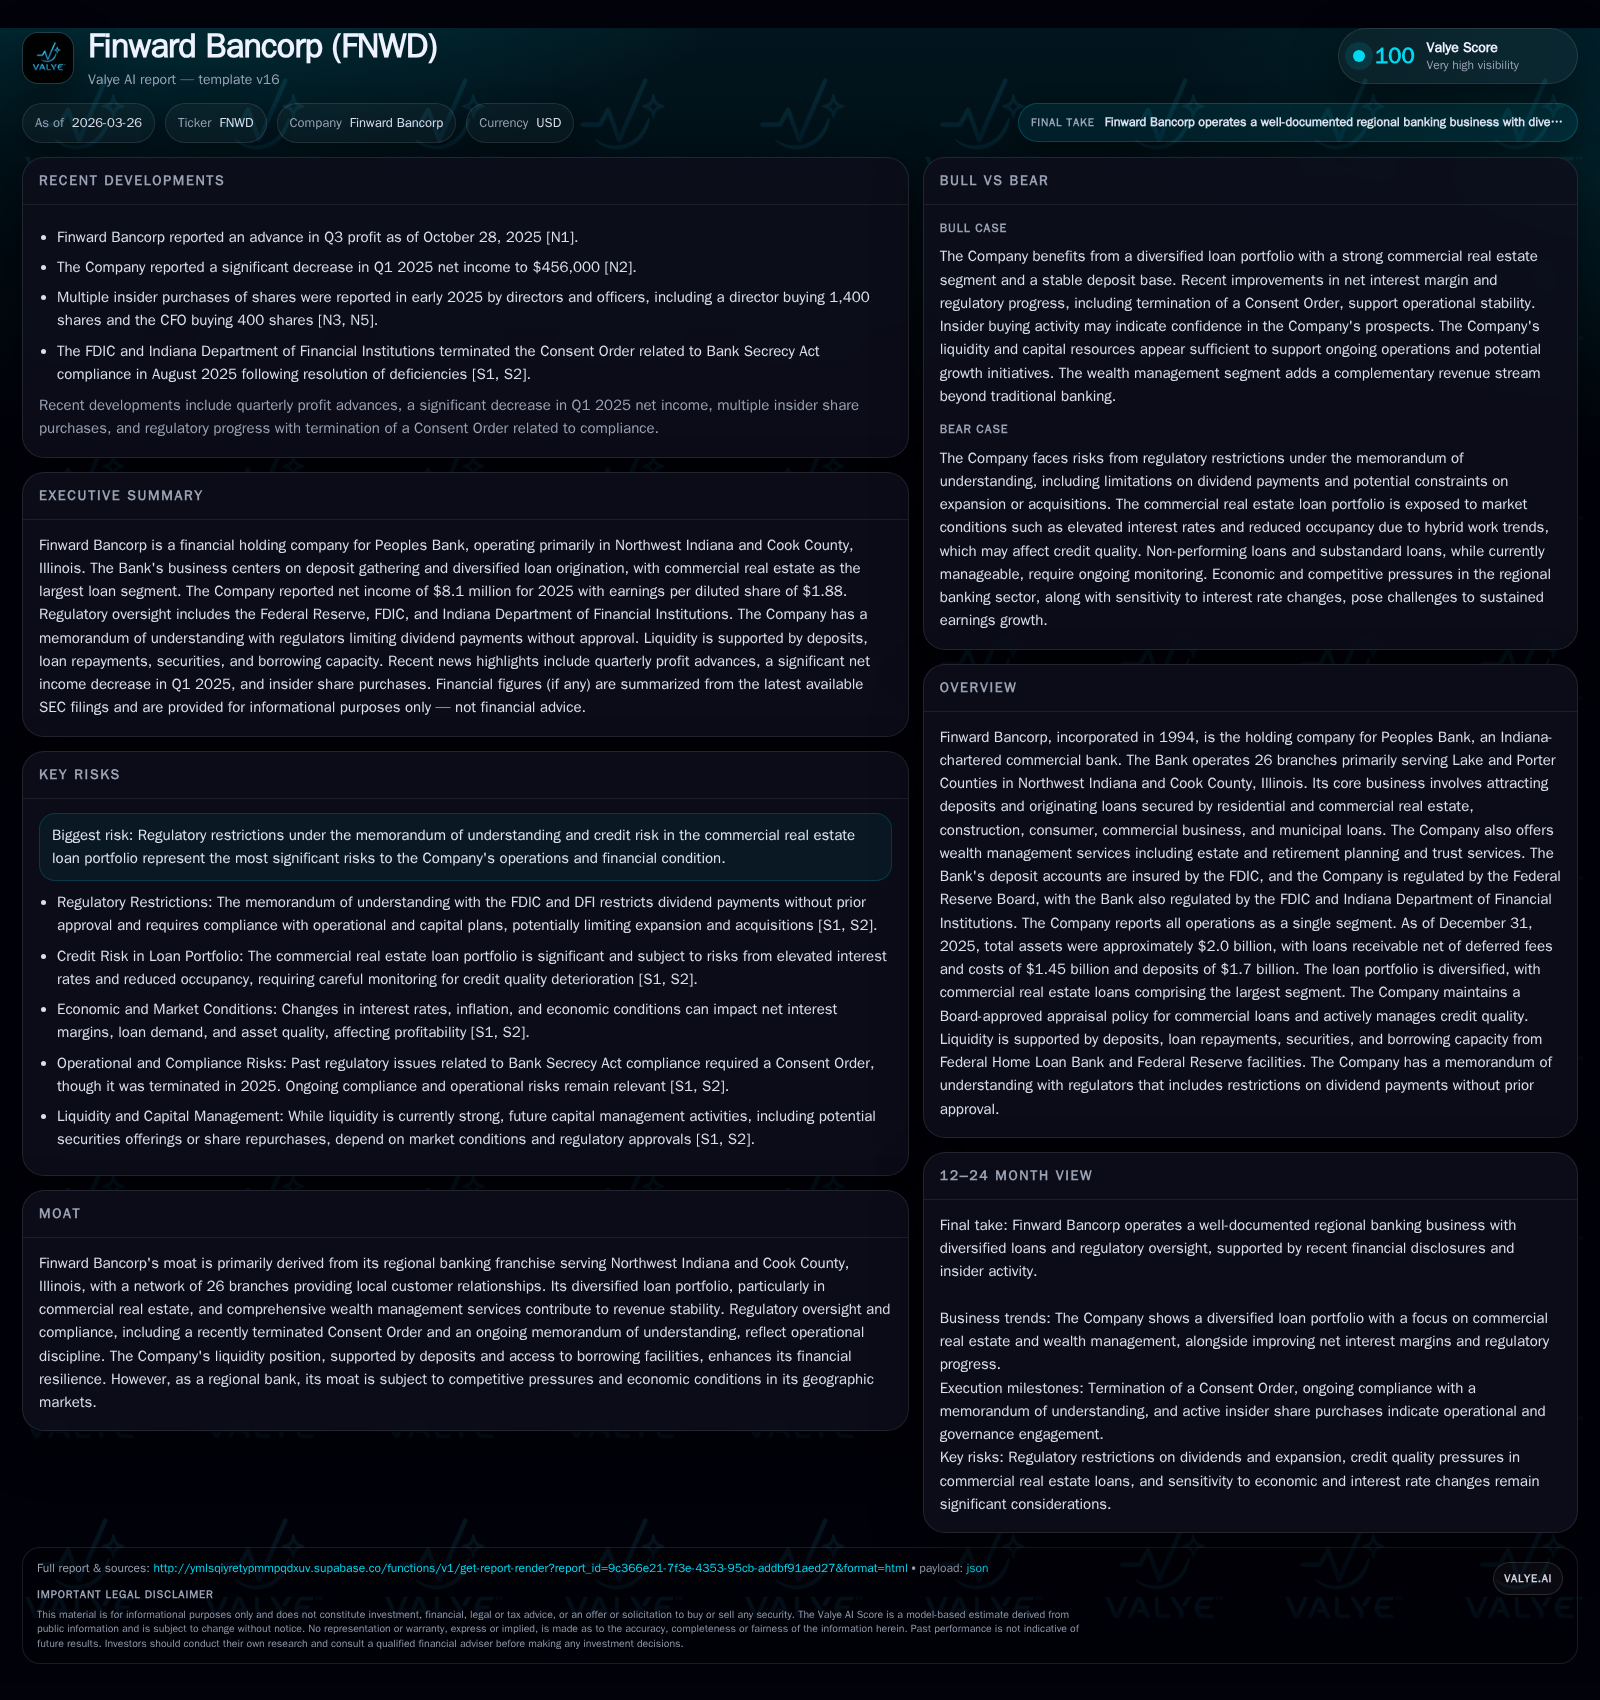
In 2025, Finward Bancorp concluded a significant regulatory compliance phase with the termination of a Bank Secrecy Act-related consent order, marking a turning point in its operational discipline. Despite this milestone, the company faced headwinds including a 33.3% decline in net income to $8.1 million and modest returns on equity around 4.6%, primarily driven by contraction in loan balances, particularly commercial real estate, and ongoing regulatory constraints limiting dividend flexibility. The bank’s asset base remained steady near $2.0 billion with a deposit base of approximately $1.7 billion concentrated in Northwest Indiana and Cook County, Illinois. Looking ahead, regulatory oversight continues via an ongoing memorandum of understanding that tempers growth ambitions and capital deployment strategies.
Financial Snapshot and Branch Network Footprint
Finward Bancorp functions as the financial holding company for Peoples Bank, an Indiana-chartered commercial bank operating primarily within Lake and Porter Counties in Northwest Indiana and Cook County, Illinois. The bank's operational footprint includes 26 branches supporting a regional banking franchise focused on retail and commercial lending.
As of December 31, 2025, total assets stood at approximately $2.0 billion while loans receivable net of deferred fees and costs declined marginally to about $1.45 billion — down from $1.51 billion at year-end 2024 [S1][S2]. Deposits contracted slightly to roughly $1.7 billion from $1.76 billion at the close of 2024 reflecting strategic adjustments amidst a dynamic deposit pricing environment [S10][S11]. Finward’s lending portfolio remains diversified across residential real estate, commercial real estate, construction loans, consumer loans, and municipal credit exposures.
Complementing its lending business is a wealth management division offering complex fiduciary services including estate planning and trusts that help stabilize non-interest income streams within a single-reportable segment structure [S1].
Recent Regulatory Developments and Operational Discipline
A pivotal event shaping Finward’s recent trajectory was the termination on August 6, 2025, of the Consent Order issued in November 2023 that targeted deficiencies in the Bank Secrecy Act compliance program relating to anti-money laundering controls [S1][S2]. Resolving these issues enabled the company to lift prior regulatory encumbrances that had imposed operational constraints.
However, an active memorandum of understanding (MOU) entered into in August 2024 remains in place [S1][S2][S13]. This MOU mandates strict operational adherence including refraining from paying cash dividends without regulator approval — effectively limiting capital distribution flexibility — alongside compulsion for quarterly progress reports detailing compliance initiatives [S13]. Although management anticipates limited day-to-day disruptions stemming from these agreements, the MOU could delay or restrict business expansion activities such as acquisitions or aggressive growth strategies.
Loan Portfolio Dynamics and Deposit Trends
The loan receivables portfolio edged down by roughly $60 million during 2025 reflecting both amortization and selective credit risk management especially within commercial real estate segments situated in the Midwestern markets it serves [S24][S18]. Compositionally, commercial real estate retained a dominant share but showed signs of moderation with increased focus on quality underwriting amid uncertain economic cycles [S24]. Residential real estate loans similarly declined slightly.
Deposits totaled approximately $1.7 billion as of year-end – down nearly 2% year-over-year - primarily impacted by reduced certificate of deposit balances (-10.8%) while more liquid products like money market accounts grew (+14%) as customers shifted preferences towards flexibility amidst market rate volatility [S10][S11]. This mix influenced both funding costs and liquidity management priorities.
Profitability Metrics and Historical Trajectory
Finward experienced notable pressure on profitability markers during fiscal year 2025 [F1][S1]. Net income dropped to approximately $8.1 million from $12.13 million in 2024 — a decline of about one-third (-33.3%), correlating with a lower net interest margin environment compounded by parts attributed to regulatory impacts on expense structures and restricted capital actions.
Consequently, return on equity compressed to an estimated ~4.6% based on reported net income relative to shareholders' equity reaching $174.7 million as of December 31, 2025 [F1]. Comparable return on assets fell below half a percent (0.39%), underscoring profitability challenges despite operational scale.
This contraction illustrates how regional banks such as Finward confront margin headwinds driven by competitive pressures for deposits and cautious loan growth amid tighter regulatory oversight.
Liquidity Position and Capital Structure Management
Liquidity management remains critical for Finward as it balances funding profitability against ensuring sufficient cash resources for loan demand and operational obligations.
Core liquidity components include unencumbered cash balances exceeding $119 million at year-end along with investments available for sale comprising municipal securities and mortgage-backed instruments totaling over $335 million [S4][S10]. Additionally, the company retains access to borrowing facilities through the Federal Home Loan Bank with borrowing capacity near $436 million (outstanding advances were reduced from $65 million in late-2024 to $45 million at end-2025) alongside Federal Reserve discount window availability around $252 million not utilized at period's close [S5][S12][S29].
Total borrowed funds declined by nearly one-fifth to about $85 million driven primarily by scheduled maturities reducing reliance on external funding [S10]. This prudent debt reduction complements deposit stability aimed at preserving an optimal ratio of interest-earning assets against interest-bearing liabilities.
Shareholder Returns: Dividends, Equity Growth, and Buybacks
During fiscal year 2025, Finward paid out dividends totaling roughly $1.56 million (a decrease from previous years’ payouts), consistent with MOU restrictions prohibiting dividends without prior regulatory consent [F1][S28][S3]. The Board declared a quarterly dividend payment early March 2026 amounting to $0.12 per share underscoring continued commitment to capital return discipline post-consent order relief [S3].
Stockholders’ equity expanded about 15% during the year reaching approximately $174.7 million fueled by retained earnings alongside unrealized gains attributable to favorable securities portfolio valuations contributing other comprehensive income [F1][S10]. However, share repurchases remain minimal or absent pending further easing of regulatory limitations — highlighting cautious capital deployment under constrained conditions.
Historical Financial Summary for Finward Bancorp (FY2022-FY2025)
Historical performance (annual)
| FY | Net ($mm) | CFO ($mm) | Capex ($mm) | Net YoY |
|---|---|---|---|---|
| 2025 | 8 | 10 | 1 | -33.3% |
| 2024 | 12 | 10 | 3 | +44.7% |
| 2023 | 8 | 24 | 1 | -44.4% |
| 2022 | 15 | 18 | 3 |
Source: SEC companyfacts cache [F1].
Capital returns and efficiency (annual)
| FY | Div ($mm) | FCF ($mm) | ROE% |
|---|---|---|---|
| 2025 | 2 | 9 | 4.6 |
| 2024 | 2 | 7 | 8.0 |
| 2023 | 5 | 23 | 5.7 |
| 2022 | 5 | 15 | 11.1 |
Source: SEC companyfacts cache [F1].
Future Prospects under Ongoing Regulatory Constraints
Operating under the lingering terms of the MOU necessitates Finward maintain vigilance around capital distributions and strategic expansion initiatives which may be curbed or delayed until formal modifications or termination granted by regulators [S13][S17]. This reality tempers expectations for rapid asset growth or acquisitions despite otherwise sound core banking operations.
Management continues evaluating implications arising from recent tax legislation—the One Big Beautiful Bill Act—with potentially complex effects still uncertain given evolving IRS guidance [S1][S2]. In addition, key risk factors remain tied to credit quality trends within commercial real estate exposure given geographic concentration risks.
Monitoring Milestones: What Investors Should Watch Next
Absent explicit guidance forecasts beyond established reporting requirements, stakeholders should monitor Finward’s quarterly progress submissions concerning MOU adherence plus indicators such as loan portfolio quality improvements or deteriorations measured through classified loans reduction trends.
Earnings trajectory stability post-consent order termination will also serve as bellwethers for underlying franchise health amid ongoing macroeconomic pressures. Additional scrutiny should be placed on dividend policy shifts signaling regulatory comfort levels impacting capital flexibility.
This analysis consolidates publicly disclosed financial statements filed through March 25, 2026 [F1], without speculative extrapolations or investment recommendations.
Disclaimer: This is research-only, informational analysis and not investment advice. It may include AI-generated interpretation and general industry context. Always verify important details using primary sources.
Comments