
ECB Bancorp Elevates Profits Through Strategic Real Estate Lending and Community Roots
Focused expansion in commercial and multifamily real estate lending alongside steadfast local banking relationships underpins ECB Bancorp’s near doubling of net income in 2025.
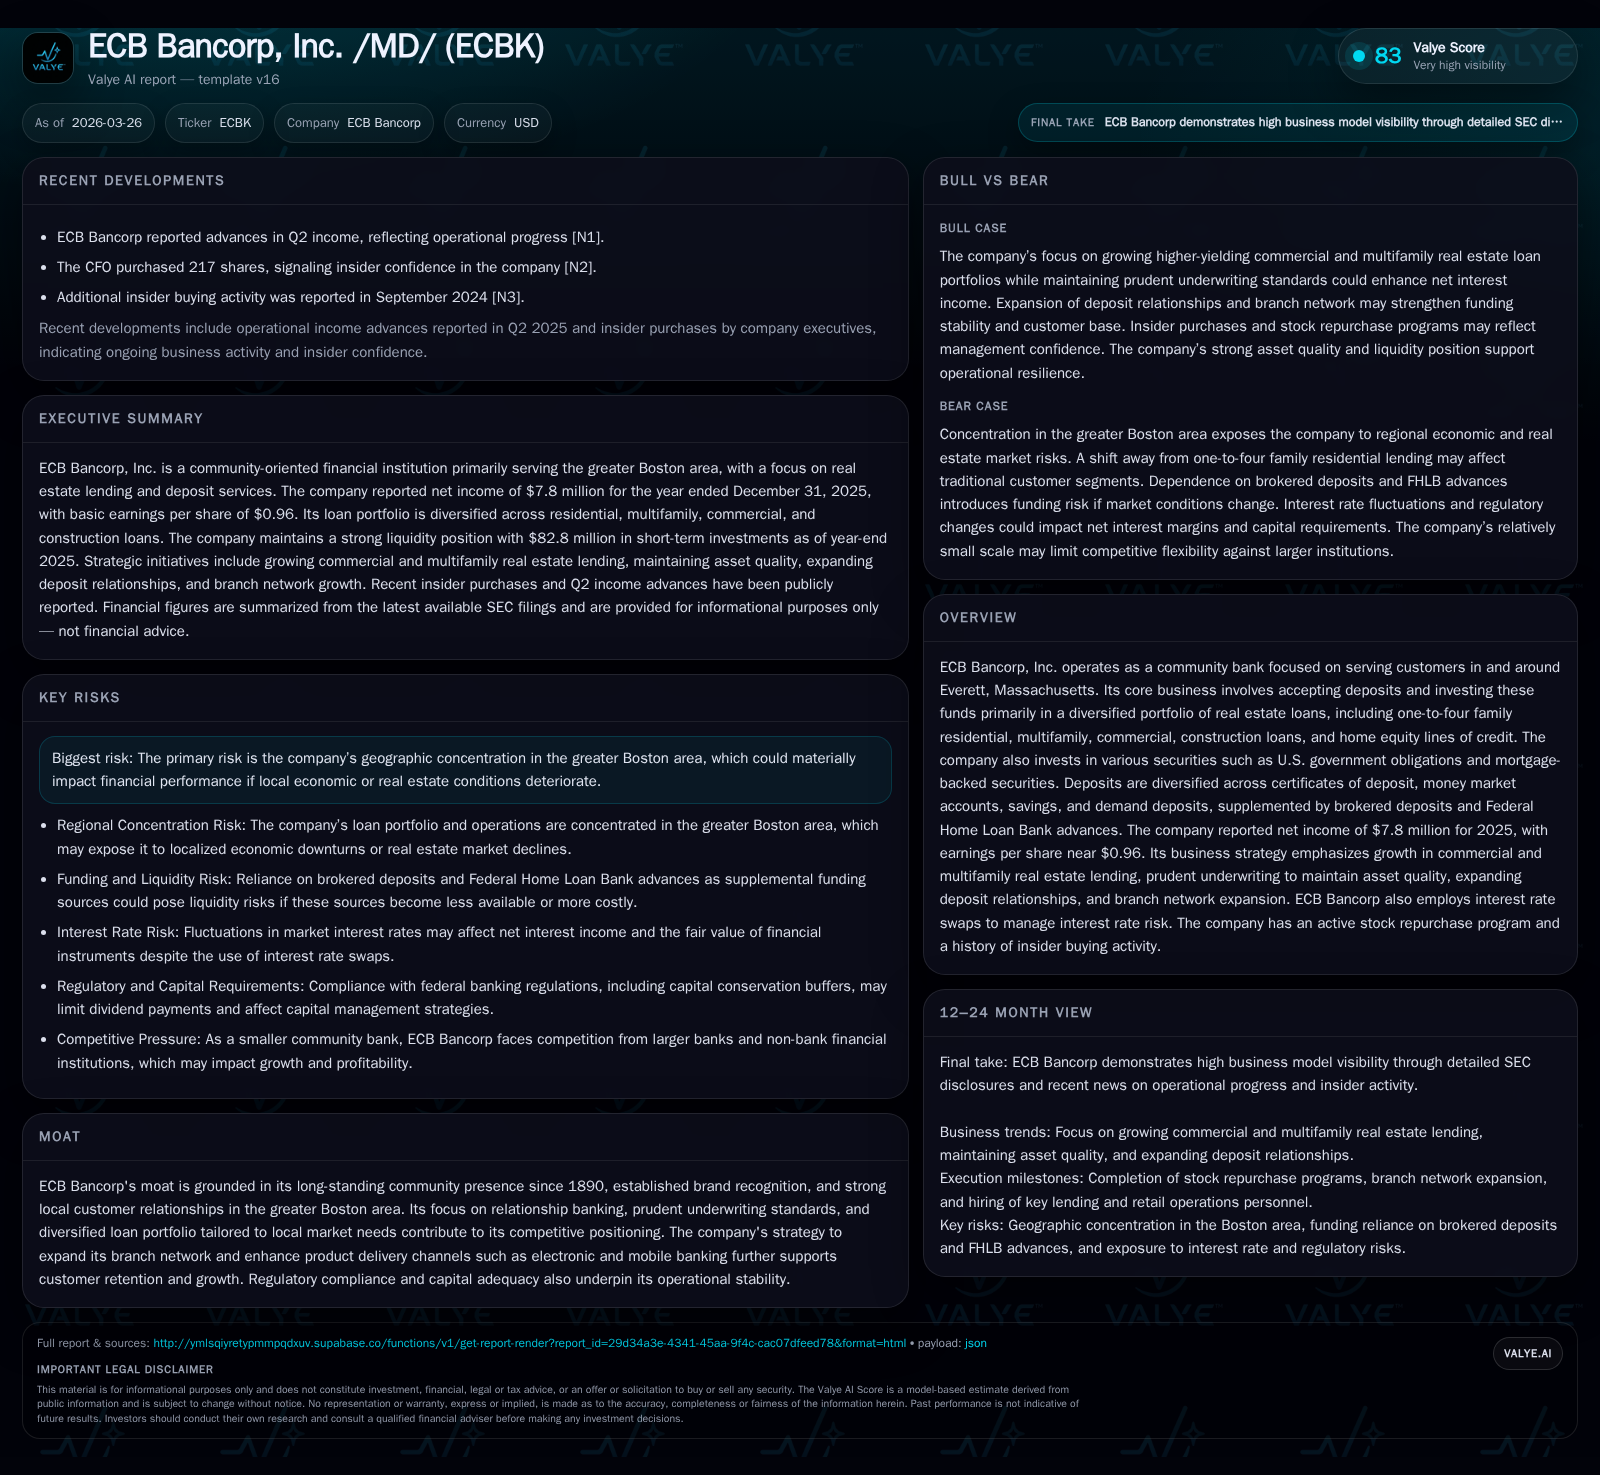
ECB Bancorp, a community bank entrenched in the greater Boston area, nearly doubled its net income to $7.8 million in 2025 driven by targeted growth in commercial and multifamily real estate loans. The bank’s shift away from one-to-four family residential loans towards higher-yield commercial segments, prudent underwriting standards, and enhanced electronic banking services fortify its local franchise. Capital management through dividends, share repurchases, and employee stock ownership complements solid balance sheet fundamentals despite geographic concentration risks inherent to the Boston market.
Surging Earnings on a Foundation of Real Estate Lending Evolution
ECB Bancorp demonstrated a remarkable net income increase of nearly 95% in 2025, rising from approximately $4.0 million in 2024 to $7.8 million [$F1]. This profit boom closely aligns with strategic growth in real estate lending, which remains the core revenue driver. The bank's diligent maintenance of asset quality is evident as nonperforming assets declined to just 0.07% of total assets at year-end [$S1][$S23]. Concurrently, operating cash flows advanced by approximately 46%, increasing from $6.3 million to $9.2 million, signaling robust underlying cash generation capability [$F1]. Capital expenditures spiked by over 250% to $214,000 reflecting investments linked to branch expansions—including the recent opening of a third branch—which supports sustainable growth initiatives [$F1][$S8]. Equity capital steadily rose to $172 million, underpinning the institution’s cushioning against loan portfolio risks.
Shifting Portfolio Mix: Commercial & Multifamily Focus Driving Growth
Transitioning toward higher-yielding credit segments, ECB Bancorp shifted emphasis from one-to-four family residential loans toward commercial and multifamily real estate portfolios as part of its deliberate repositioning strategy [$S14][$S26][$S29]. Multifamily loans increased by $81.5 million or more than 23%, reaching $425.4 million at year-end while commercial real estate loans echoed this pattern with meaningful growth [$S29]. Construction loans and home equity lines of credit complement this mix but remain comparatively smaller portions. This adjustment is responsive to localized demand dynamics within Greater Boston’s mixed-use property markets where loan-to-value considerations guide credit approval processes diligently discussed internally [$S27]. The broader mix supports deposit growth stemming largely from commercial clients’ deposits, enhancing interest income streams due to typically higher spreads.
Local Market Strengths Underpin Customer Loyalty and Relationships
ECB Bancorp’s competitive mooring rests on long-standing community ties dating back over a century and brand recognition rooted strongly in Everett and surrounding Massachusetts locales [$valye_report_excerpt][$S8]. Relationship banking manifests via personalized service accompanied by modernized product delivery such as augmented electronic and mobile banking platforms strategically introduced through seasoned retail management hires [$S8]. These customer-centric innovations nurture core deposit stability which comprises diverse accounts spanning CDs (64%), money markets (19%), savings (8%), and demand deposits (8%) funneling operational liquidity effectively [$S23]. Furthermore, philanthropic efforts via corporate charitable foundations amplify community engagement fostering loyalty.
Liquidity and Capital Structure: Tightrope of Funding Amid Concentration
Effective liquidity stewardship balances core retail deposits with supplemental brokered funding ($134 million) and Federal Home Loan Bank (FHLB) advances ($285 million), ensuring resilient plasma for lending activities [$S4][$S6][$S10]. Management employs rigorous stress testing protocols simulating market disruptions consistent with advanced asset/liability management frameworks typical among regional banks [$S6][$S15]. Nonbrokered time deposits maturing within one year approximate $451 million with an anticipated high retention rate aided by stable pricing strategies [$S12]. FHLB borrowings are secured predominantly by first mortgages on owner-occupied properties maintaining required capital conservation buffers facilitating "well-capitalized" regulatory status [$S4][$S16][$S17]. However, geographic concentration exposes ECB Bancorp to localized economic oscillations particularly tied to Boston’s real estate cycles.
Capital Deployment: Dividends, Buybacks, and Employee Equity Participation
Capital allocation harmonizes shareholder returns with regulatory compliance wherein dividends are declared only out of current earnings following Federal Reserve Board guidelines emphasizing capital need consistency [$S9][$S16]. Share repurchase programs initiated in August 2023 authorized buybacks equal to about 5% of outstanding shares per tranche; the company completed its first tranche in April 2025 and promptly announced a second plan reflecting confidence in capital adequacy [$F1][$S9]. Concurrently, employee stock ownership plans (ESOP) augment internal incentives promoting alignment between staff performance metrics and shareholder value creation [$S28][$S19], with nearly three quarters million shares either outstanding or earmarked for future grants under equity incentive plans granted at fair value using Black-Scholes modeling techniques.
Navigating Regulatory Expectations and Risk in a Concentrated Market
ECB Bancorp operates within comprehensive regulatory frameworks typical for community banks focused on consumer protections alongside prudential directives [(valye_report_excerpt)][$S7][$S16]. There are no material legal proceedings pending that might threaten balance sheet integrity or earnings visibility [$S7], while supervisory policies advocate cautious dividend distribution tied tightly to retention rates preserving capital conservation buffers vital for permissible payouts. Concentration risk remains salient given portfolio aggregation largely within Greater Boston metro affecting collateral valuations during economic downturns or rising vacancy rates especially across multifamily housing sectors [$valye_report_excerpt][$S18]. Continuous credit surveillance through formal rating systems ranging from pass-rated (low risk) to substandard or doubtful grades ensures early identification of emerging credit stress[$S22][$S27].
Foresight into 2026: Observing Key Milestones and Lending Trajectory
Looking ahead, milestones focus on measured expansion via branch network augmentations targeting contiguous Massachusetts regions coupled with retention campaigns for matured deposits leveraging customer loyalty and improved digital engagement tools[$valye_report_excerpt][$S3][$S12]. Pipeline commitments for new loan originations stood at approximately $30.6 million at fiscal year-end signaling a healthy deal flow supporting planned commercial loan growth while maintaining conservative underwriting standards adopted since the Chief Lending Officer appointment in early 2022[$S26][$valye_report_excerpt]. Close attention should be paid throughout the year to deposit retention metrics relative to maturing time deposits as well as noninterest income trends related to service fees that may influence overall revenue composition (current accounts contribute less materially but remain monitored)[$valye_report_excerpt][$F1] .
Key Financial Trends: Cash Flows, ROE, and Investment Priorities
A succinct financial summary table below distills annual data highlighting the sharp rise in profitability alongside strengthening operational liquidity:
Historical performance (annual)
| FY | Net ($mm) | CFO ($mm) | Capex ($) | Net YoY |
|---|---|---|---|---|
| 2025 | 8 | 9 | 214000 | +94.7% |
| 2024 | 4 | 6 | 60000 | -10.4% |
| 2023 | 4 | 6 | 335000 | +63.8% |
| 2022 | 3 | 8 | 216000 |
Source: SEC companyfacts cache [F1].
Capital returns and efficiency (annual)
| FY | Buybacks ($mm) | FCF ($mm) | ROE% |
|---|---|---|---|
| 2025 | 5 | 9 | 4.5 |
| 2024 | 3 | 6 | 2.4 |
| 2023 | 6 | 2.7 | |
| 2022 | 8 | 1.7 |
Source: SEC companyfacts cache [F1].
Return on equity remains at a moderate ~4.5%, consistent with a community bank balancing growth ambitions with capital preservation priorities[$F1]; free cash flow generation exceeds $9 million enabling simultaneous reinvestment into infrastructure expansions such as technology enhancements while also supporting dividends and share repurchases[$F1].[^note1]
[^note1]: Capex variability reflects timing of branch openings and technology investments.
This detailed review encompasses ECB Bancorp’s strategic execution blending traditional relationship banking strengths grounded in its Everett/Greater Boston heritage with progressive real estate loan diversification and disciplined capital management structures critical for navigating localized systemic risks inherent to community banking models.
Disclaimer: This analysis is based solely on disclosed company financials, SEC filings, and publicly available information as noted; it does not constitute investment advice or a recommendation regarding ECB Bancorp securities.
Disclaimer: This is research-only, informational analysis and not investment advice. It may include AI-generated interpretation and general industry context. Always verify important details using primary sources.
Comments