
Franklin BSP Capital Strengthens Middle Market Debt Portfolio with Stable Leverage
FRBP reported a modest contraction in net investment income amid declining investment income but maintains robust liquidity and asset coverage.
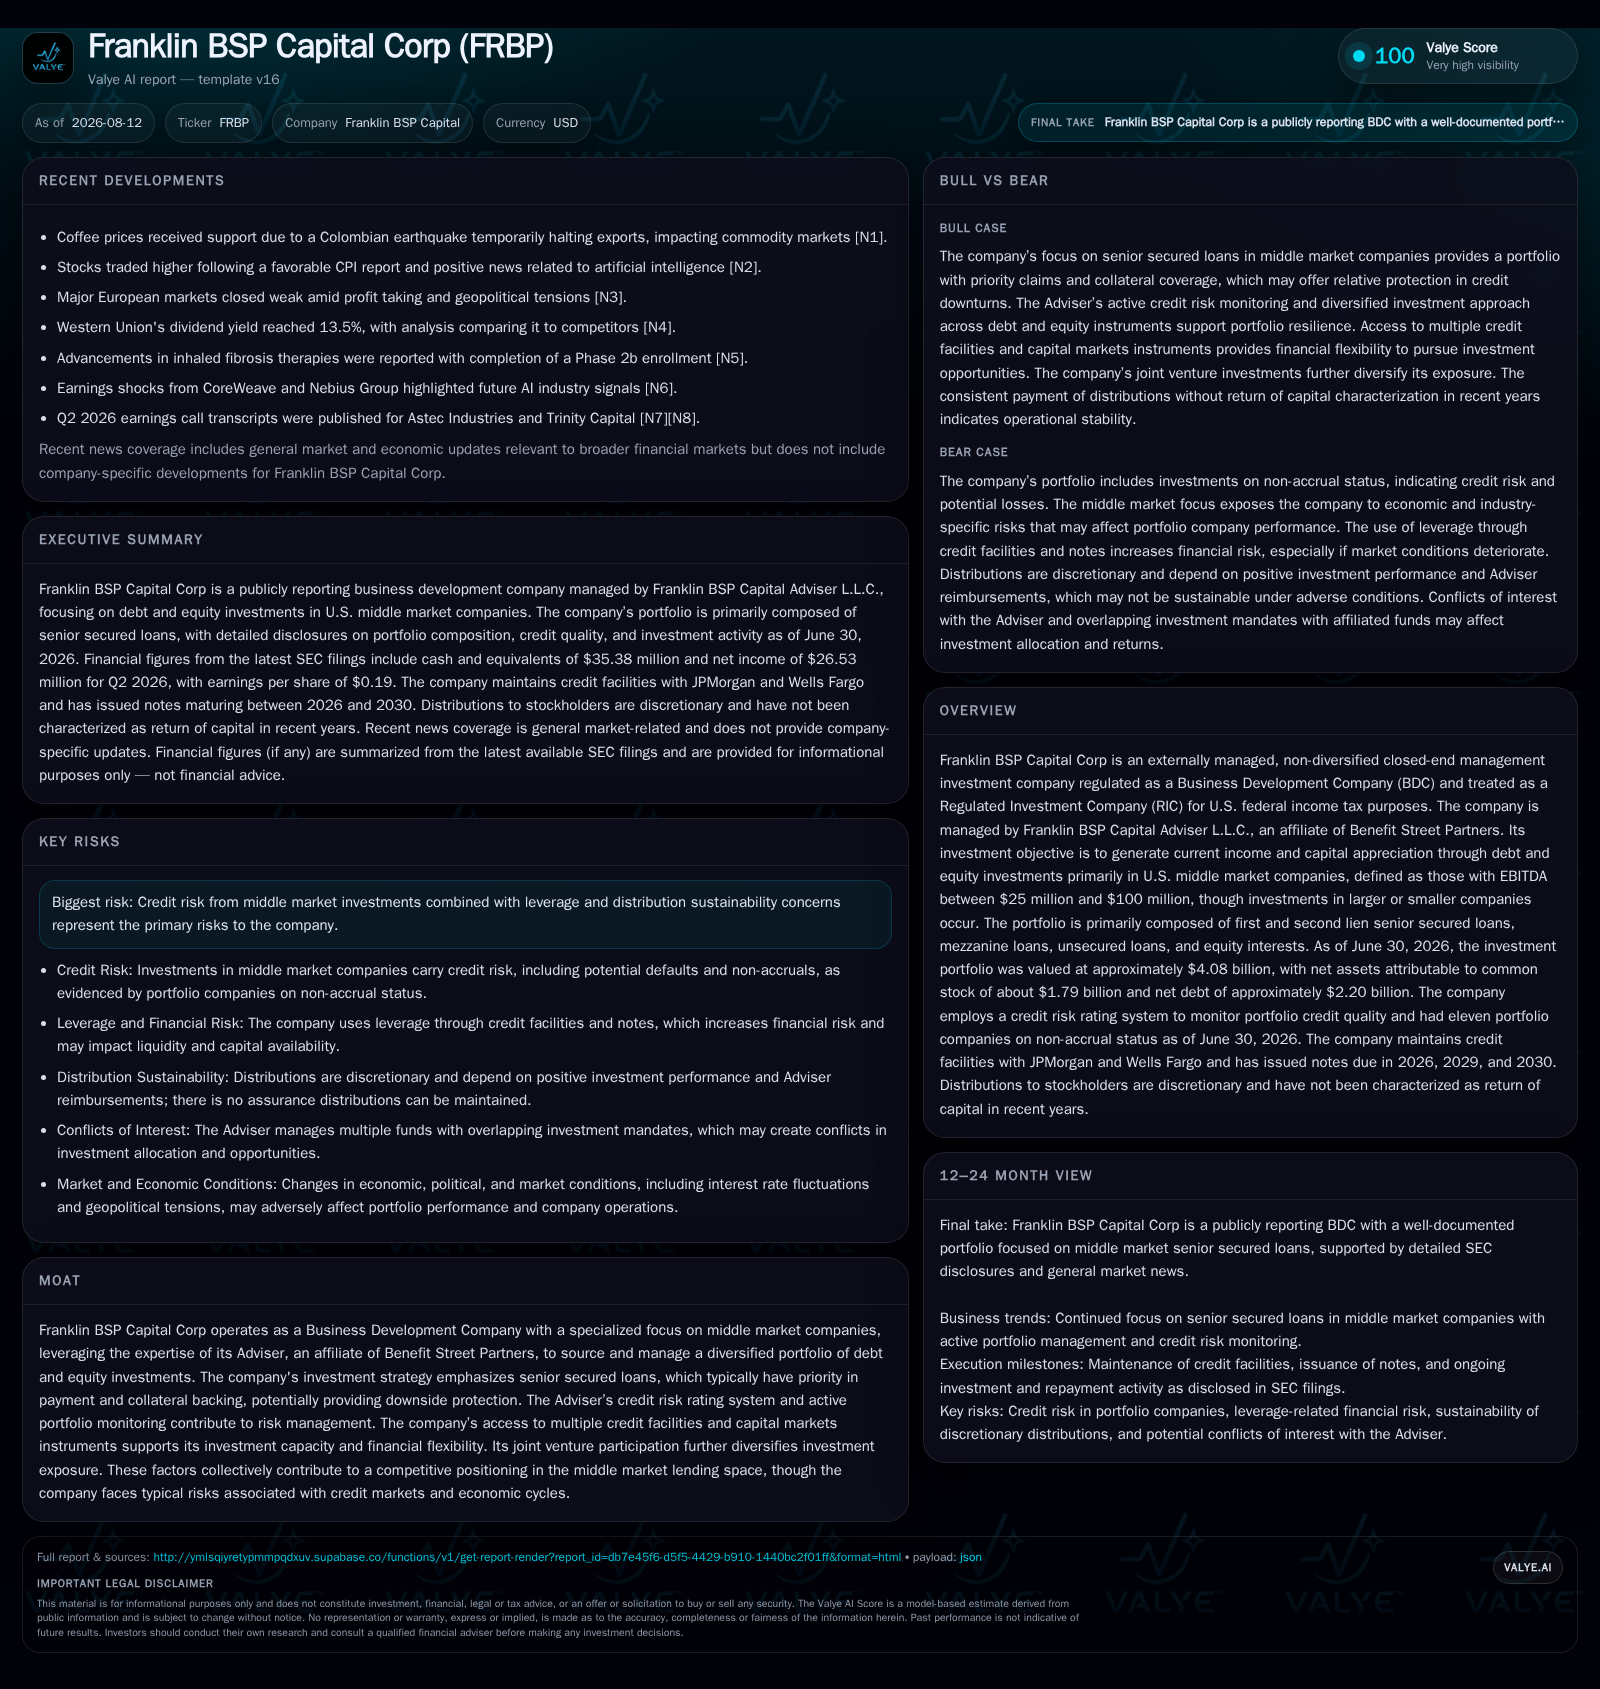
Franklin BSP Capital Corp (FRBP), an externally managed BDC that primarily targets U.S. middle market companies through a diversified debt portfolio, experienced lower investment income in Q2 2026 compared to the prior year after interest rate and credit market shifts impacted yields. The firm’s portfolio remains concentrated in senior secured loans with a weighted average yield of approximately 9.3%, supported by ample credit facilities and strong asset coverage at 178%. Despite the income softness, FRBP’s disciplined leverage and diversified portfolio position it to navigate middle market credit demand dynamics while maintaining distribution capacity. Key risks include credit quality deterioration and distribution sustainability amid evolving economic conditions.
Recent Operating Update: Q2 2026 Results Highlight Income Pressure
Franklin BSP Capital Corp’s Q2 2026 filings reveal a meaningful decline in investment income to $13.2 million from $20.8 million in the year-ago quarter, pulling net investment income (NII) down to $6.1 million from $11.2 million during the same period [S2]. This drop indicates pressure on portfolio yields or lower accruing income due to repricing or credit deterioration effects common in the current macroeconomic environment where interest rates have fluctuated notably. The accompanying decline in financing costs helped offset some margin compression but overall expenses stayed proportionally steady. These dynamics underscore a short-term operating headwind that requires monitoring of subsequent quarters for signs of yield stabilization or improvement.
Business Model: Middle Market Focus with Debt Income Generation
FRBP operates as an externally managed Business Development Company (BDC), investing predominantly in U.S.-based middle market companies characterized by EBITDA between $25 million and $100 million [S1]
Revenue is principally generated from interest payments on debt instruments with incremental fee income arising from loan origination and structuring activities [S15]. The majority senior secured loans provide priority claim on borrower assets, offering enhanced downside protection compared to unsecured or equity tranches that constitute smaller portions of the portfolio (~7.8% equity/other plus ~5.3% via its Senior Loan Fund LLC subsidiary) [S2].
Management remunerates an affiliate investment adviser under an amended agreement effective January 2024, which aligns incentive compensation partly with net investment income performance but exposes FRBP to potential incentive fees based on accrued but unpaid interest that may never be realized if portfolio defaults occur—a structural risk intrinsic to many BDCs [S1]
Industry Context: BDCs as Middle Market Credit Intermediaries
BDCs serve as regulated intermediaries providing capital solutions where traditional banks have retreated due to regulatory constraints post-financial crisis. These vehicles attract investors seeking access to private credit assets that often deliver higher yields than public fixed income counterparts but come with illiquidity and credit risks.
Peer public BDCs such as Ares Capital Corporation (ARCC), Golub Capital BDC, and Trinity Capital Corporation offer comparable exposure yet vary in scale, leverage appetite, and product mix. FRBP's $4+ billion asset base places it in the mid-to-upper range among publicly traded BDCs focusing on middle market lending [S1]. Its differentiated advantage rests partly in its adviser’s ability to source proprietary deal flow through Benefit Street Partners’ network plus disciplined credit selection leveraging internal risk analytics.
Critical KPIs industry-wide include NAV per share stability, investment income consistency, portfolio yield trends, non-performing asset ratios, leverage levels relative to equity capitalization, expense efficiency, distribution payout ratios, and realized/unrealized gains—which collectively shape return profiles and investor confidence.
Growth Drivers: Expanding Middle Market Credit Demand
Structural shifts favor increased reliance on alternative lenders like BDCs for middle market financing needs—the segment often underserved by traditional banks due to customization demands or regulatory capital impediments.
FRBP’s sizable unfunded commitments (circa $678 million as of mid-2026) suggest ongoing deal flow demand fueled by new loan originations or follow-on investments requiring tactical capital deployment [S18]. Additionally, continued access to substantial revolving credit lines—$780 million JPMorgan facility (extendable up to $1.17 billion) plus a $300 million Wells Fargo revolver—provide financial flexibility for calibrating growth while managing liquidity risks [S14].
Investment opportunities also are influenced by macroeconomic factors including corporate leverage appetites linked to prevailing interest rates; hence rising rates could improve future portfolio yields subject to borrower credit resilience.
Risks & Watchpoints: Credit Quality & Distribution Sustainability Focus
Credit risk dominates concerns given concentration in middle market borrowers vulnerable to economic slowdowns or sector-specific disruptions [S1]. The presence of unsecured loans (~6.8%) increases potential volatility in performance metrics relative to more secured instruments with fixed claims.
The company must also manage leverage carefully. While current asset coverage at 178% exceeds regulatory minimums affording cushion versus peers who may operate closer to mandated thresholds [S14], any loosening amid adverse credit trends could amplify losses.
Another watchpoint is distribution coverage linked tightly to net investment income — especially since incentive fees potentially paid on accrued but unrecovered interest raise questions about cash earnings alignment impacting dividend sustainability over time. Investors should monitor quarterly NII dynamics alongside realized losses or mark-to-market impairments.
What To Watch Next: Earnings Trajectory & Leverage Adjustments
Key upcoming indicators for FRBP include subsequent quarterly NII stabilization or improvement signaling successful navigation of interest rate environments; movement in non-performing assets ratio indicating credit health; updates on unfunded commitments utilization demonstrating origination pipeline strength; changes in leverage metrics following refinancings or new debt issuances impacting cost-of-capital; as well as board-approved adjustments to distributions reflecting returns strategy.
Monitoring changes within the advisory agreement framework or potential amendments could signal shifts in fee structures affecting longer-term profitability aligned incentives.
Financial Profile Discussion
As of June 30, 2026, Franklin BSP maintained cash and equivalents of approximately $35 million against total debt outstanding near $2.2 billion resulting in net debt close to $2.16 billion [F1]. The company's reported asset coverage ratio stood at a prudent 178%, comfortably above the statutory minimum of 150% imposed on BDCs, confirming conservative leverage usage relative to peers who often employ higher leverage ratios at elevated risk levels [S14].
Credit facilities underpinning liquidity include the sizeable JPM Credit Facility ($780 million capacity extended through January 2030) featuring customary covenants and default provisions protecting lenders’ interests plus a Wells Fargo revolving facility ($300 million capacity expiring August 2028) priced at SOFR-based spreads around 2.15%-2.75% net of amendments reducing borrowing costs [S4,S5,S17,S18]
Expenses remained relatively stable indicating operational discipline but any downward pressure on net earnings necessitates careful cost management alongside potential adjustments in incentive fee structures negotiated with advisers.
Franklin BSP’s sustained capital commitment levels nearing $700 million in unfunded obligations signal investor confidence granting continued growth runway although these resources require prudent deployment aligned against prevailing economic uncertainty [S18]
This analysis reflects publicly filed disclosures from August 2026 supplemented by industry-standard framing pertinent to publicly traded Business Development Companies investing predominantly in U.S.-based middle market companies’ debt instruments. It does not constitute investment advice or research views but provides insight into Franklin BSP Capital’s current operational posture within the dynamic private credit landscape.
Disclaimer: This is research-only, informational analysis and not investment advice. It may include AI-generated interpretation and general industry context. Always verify important details using primary sources.

Comments