
Black Rock Coffee Bar Strengthens Unit Economics Amid Continued Drive-Thru-Lobby Expansion
BRCB’s latest quarter shows solid same-store sales growth and improved store-level margins supporting its rapid footprint expansion in the premium drive-thru coffee sector.
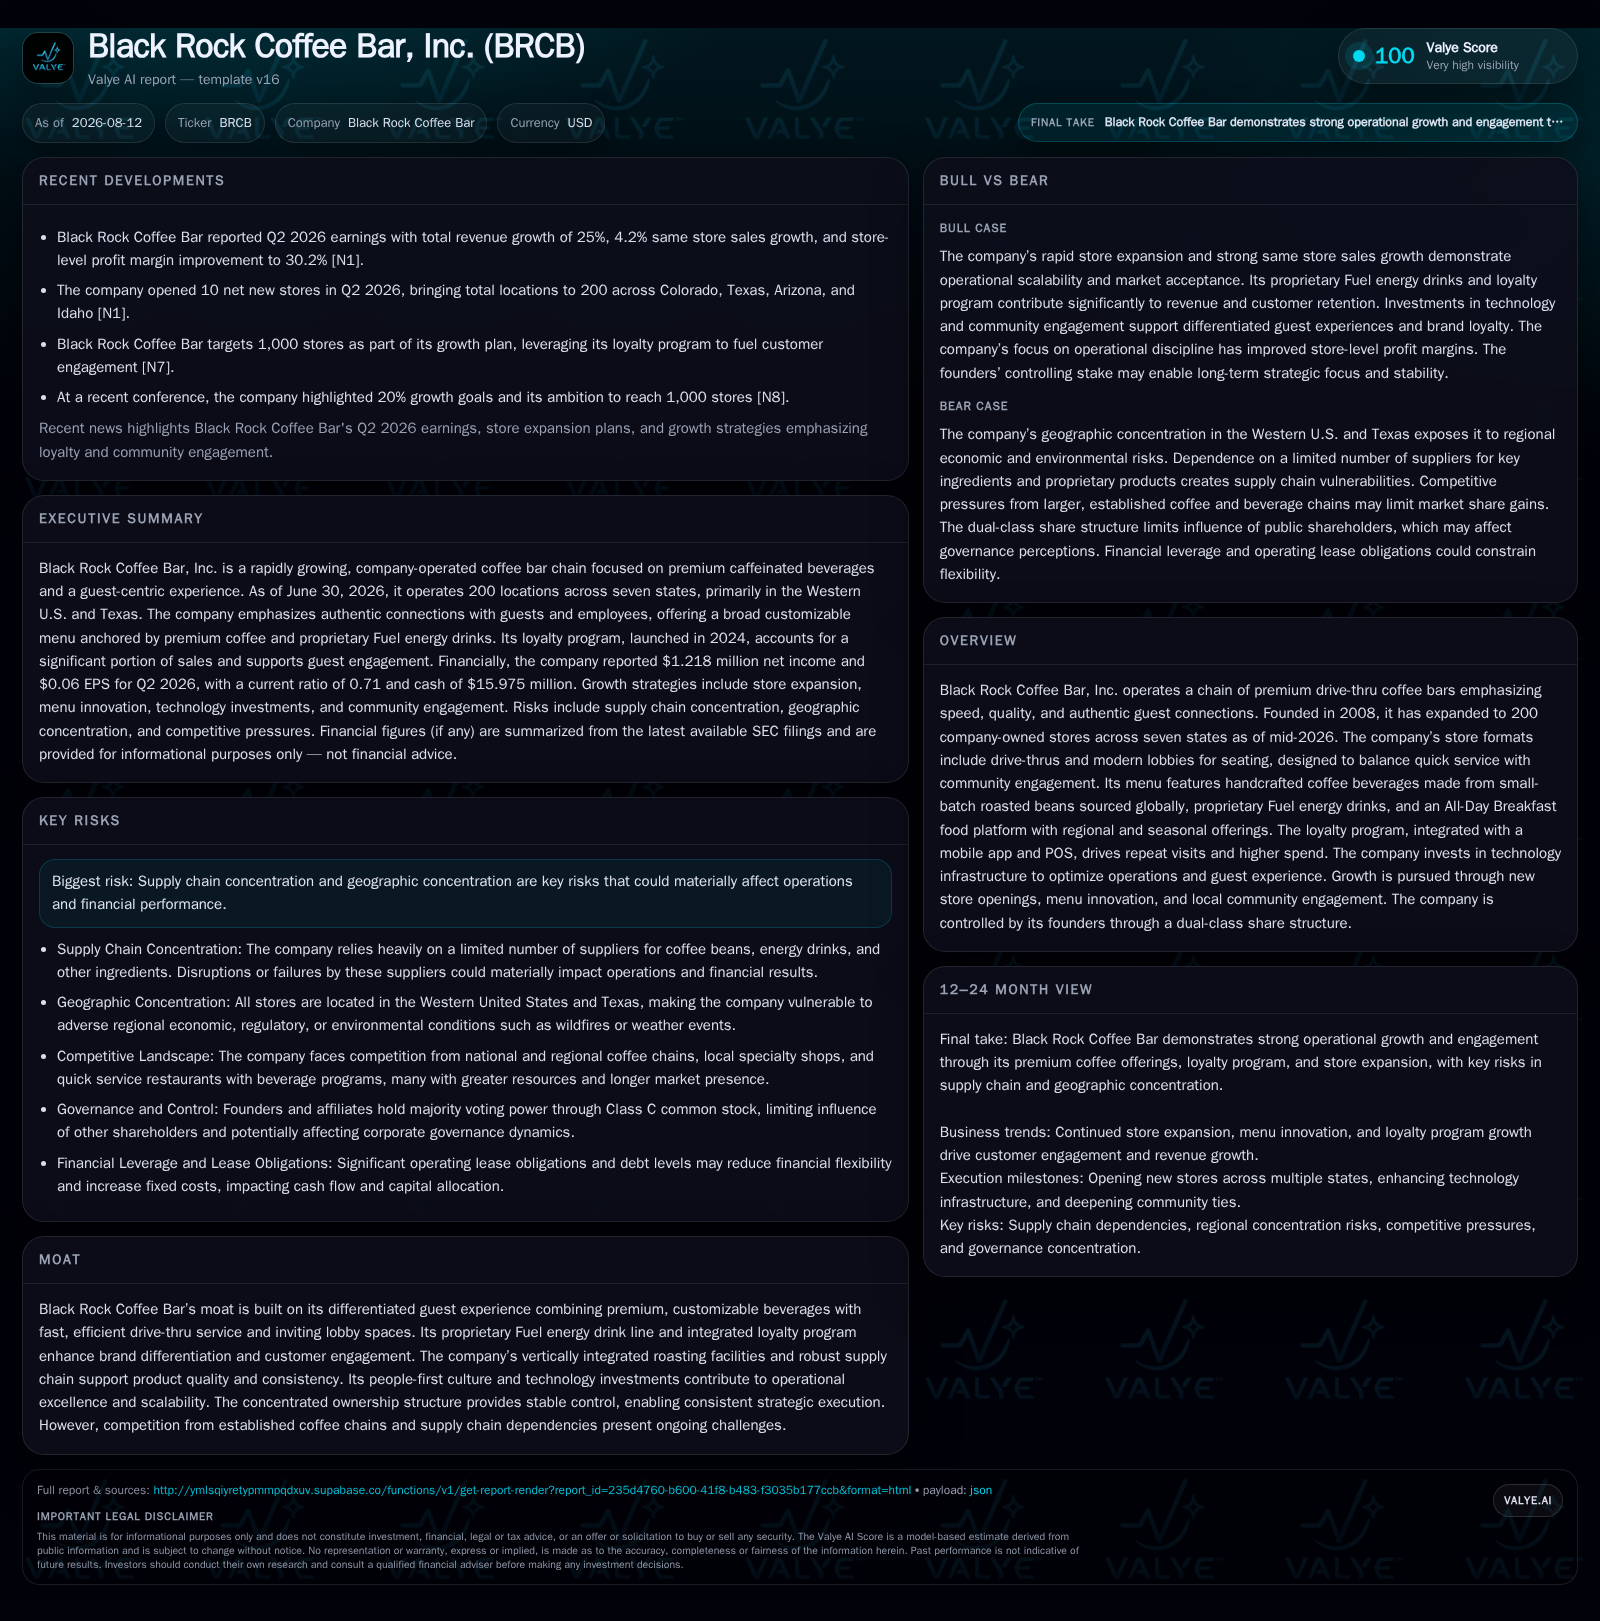
Black Rock Coffee Bar, Inc. reported another strong quarter to June 2026 with 200 company-owned stores across seven states. Total revenue grew 25% year-over-year, propelled by both net new store openings and 4.2% same-store sales growth driven by price increases and higher check size despite some traffic softness. The company expanded its store-level profit margin to 30.2%, reflecting operational discipline and improving unit economics typical of scaled drive-thru formats. Continued investments in lobby seating alongside drive-thru service point to a strategic balance between speed and guest experience. BRCB’s growth faces typical specialty coffee retail risks such as supply chain concentration, commodity cost pressure, labor inflation, and geographic concentration but benefits from a loyal customer base fostered through a proprietary loyalty program and menu innovation, including energy drinks.
Recent Operating Update
topline progress.
Operationally, the business demonstrated enhanced unit economics with a store-level profit margin improving from 29.5% in Q2 last year to 30.2% currently—an indicator of heightened efficiency at the store level during disciplined cost controls on beverage procurement and labor management alongside gradual scale benefits accruing as stores mature in their catchment areas [S2]. Income from operations margin remained stable at 6.5%, reflecting steady absorption of corporate overhead expenses even while investing notably into pre-opening activities (which increased from $843K to $1.25M quarterly) necessary for new unit rollout plus digital infrastructure upgrades intended to enhance guest experience through mobile ordering and loyalty capabilities [S2]. The consistent income margin despite expansion costs signals managerial effectiveness in managing growth without eroding profitability.
Business Model Details
Rooted in its founding drive-thru concept since 2008 in Oregon, Black Rock has evolved its retail format to merge fast-service convenience with inviting intimate "lobbies," now present in approximately three-quarters of their locations—capturing consumers seeking both quick pickups and relaxed sit-down moments [S1], [S2]. The menu centers on handcrafted coffee beverages made exclusively from small-batch roasted beans processed weekly at company-controlled roasting facilities ensuring freshness within a two-week consumption window—a critical factor underpinning quality differentiation for discerning coffee drinkers familiar with bean origin impact on flavor profiles [S1]. Alongside classic espresso-based offerings like Americanos and customizable lattes available at competitive price points enhancing perceived value, proprietary products such as the Fuel energy drink line provide brand-specific alternatives boosting beverage mix diversity [S1]. Complementarily, an all-day breakfast food menu with regionally attuned selections supports incremental basket expansion aligned with local consumer preferences.
Revenue is principally generated through direct retail transactions at company-operated stores rather than franchising or wholesale distribution. The company leverages an integrated loyalty program tightly coupled with its digital ordering platform accessible via mobile app or POS systems inside stores [S1]. This platform enables seamless promotion targeting, reward tracking, guest data analytics, and streamlined order flow—all instrumental in sustaining high repeat visitation rates critical for stable comparable sales performance within specialty beverage retailing where consumer habits strongly influence lifetime value.
Store economics balance capital investment with operating returns: newer units typically constructed with both drive-thru windows capable of handling fast transactions alongside lobby seating requiring more upfront real estate expense but generating higher guest engagement levels over time—a dual-format approach that diversifies revenue touchpoints while extending average guest dwell time enhancing ancillary sales potential [S1], [N1]. Pre-opening costs remain material but are managed relative to expected ramp-up trajectories measured against benchmark unit economics metrics like store-level profit margins.
Industry Structure and Competitive Position
The specialty coffee retail industry is intensely competitive, dominated globally by large chains such as Starbucks Corporation which leads in digital engagement innovation and global brand reach. Regional peers include Dunkin' Brands focusing heavily on drive-thru convenience and extensive menus alongside fast-growing players like Dutch Bros known for customer-centric experience dynamics emphasizing speed and personal connection. Black Rock distinguishes itself through its vertically integrated roasting process supporting product consistency not always achieved by chains relying solely on third-party roasteries or blending suppliers.
Its concentrated ownership provides stability enabling execution consistency amid fluctuating external conditions often challenging public companies pursuing rapid scale. However, geographic concentration primarily within western and southwestern U.S. markets exposes it to regional economic cycles creating demand volatility risk absent broader national diversification realized by older peers.
Operational KPIs influencing competitive positioning include same-store sales growth (SSSG), average ticket size influenced by beverage mix changes (premium energy drinks vs classic coffees), guest traffic trends reflecting brand pull factors, labor cost management amid tight hospitality labor markets prevalent industry-wide, occupancy expense control given rising commercial rents especially for larger dual-format locations featuring lobbies plus drive-thrus as opposed to smaller footprint-only units, plus loyalty program enrollment driving visit frequency improvements that supplement new unit growth.
Growth Drivers
Key engines powering Black Rock’s growth include continued store footprint expansion targeting underpenetrated metros within current states alongside entry into carefully vetted new markets balancing capital expenditures against return expectations given rising build-to-suit costs for drive-thru-lobby formats [S1], [N1]. Menu innovation remains pivotal—introducing novel beverage options seasonally aligned with consumer trends plus scaling proprietary energy beverage sales enhances average order values while creating differentiated bucket offerings difficult for competitors without vertical supply control or proprietary brands to replicate easily.
Enrichment of digital engagement through frequent updates to its mobile ordering apps integrated tightly with loyalty incentives helps convert casual buyers into repeat guests thereby investing into long-term revenue durability—a particularly effective counterweight against episodic foot traffic fluctuations caused by external economic pressures or local competitive openings.
Community marketing initiatives localized per region foster authentic connection beyond transactional exchanges capturing demographic nuances missed by cookie-cutter chain rollouts promoting stronger emotional brand attachment—a recognized driver elevating guest lifetime value.
Improved operational discipline evidenced through incremental margin improvements demonstrates capability scaling effectively without proportional SG&A inflation despite ongoing investments including technology platforms supportive of future scaling without excessive headcount ramp-ups.
Risks and Watchpoints
Critical risks stem from supply chain concentration—dependence on limited roasting facilities coupled with global commodity coffee bean pricing exposes COGS volatility risks materially affecting margins if cost inflation outpaces price pass-through capabilities especially when consumer price sensitivity limits full recovery potentials [S1], [S2]. Labor inflation persists as a challenge given competing hospitality employers vying for skilled baristas impacting wage structures adding operational complexity requiring greater efficiency gains elsewhere.
Geographic concentration—currently spanning seven states but focused mainly west/southwest raises risks linked to regional economic downturns or adverse regulatory environments affecting retail operations differently than nationwide diversified peers might absorb better.
Capital intensity inherent in building dual-format locations—larger footprints incorporating lobbies require significant upfront real estate, construction cost outlays plus elevated occupancy expenses increasing break-even thresholds potentially delaying returns relative to simpler curbside-only drive-thrus favored traditionally in faster rollout strategies.
Guest traffic softness noted recently highlights vulnerability if macroeconomic headwinds or shifting consumer discretionary spend significantly dampen visit frequency; sustaining growth relies heavily on maintaining engagement through loyalty programs effectively amid competitive noise.
Technology platform reliability remains crucial; any material failures or disruptions could impede digital ordering flows negatively impacting sales volumes or customer satisfaction levels risking reputational damage difficult to recover swiftly.
What To Watch Next
- Quarterly updates on same-store sales trends particularly transaction counts vs ticket size split will signal demand elasticity versus inflation pass-through adequacy.
- Net unit openings pace combined with pre-opening cost management will reveal capital deployment efficiency relevant given rising build costs for dual-format sites.
- Loyalty program enrollment data releases or engagement metrics acting as proxies for repeat visit sustainability under evolving consumer behavior scenarios.
- Margin trajectory changes specifically product cost percentages amidst recent supplier cost pressures will expose ability to maintain store-level profit gains.
- Regional diversification attempts beyond core seven states potentially mitigating geographic risk concentration should any expansion announcements manifest publicly.
- Menu innovation cadence impact monitored via promotional success stories or periodic revenue mix disclosures showing traction of proprietary Fuel energy drink line plus food platform extensions beyond initial geographies.
- Labor cost percentage trends reflected via SG&A expense movements tied back into store payrolls providing insight into wage pressure absorption capabilities versus productivity enhancements.
Financial Profile Discussion
Black Rock Coffee Bar’s interest expense, net decreased significantly to $0.5 million for the three months ended June 30, 2026, compared to $3.1 million for the same period in 2025, primarily driven by repaying all outstanding borrowings under the prior credit facility and entering into new credit facilities with lower interest rates and reduced borrowings [S2]
Current assets totaled $28.8 million versus current liabilities of $40.7 million, implying a current ratio of approximately 0.71, indicating tight working capital that requires careful liquidity management especially given ongoing pre-opening expenditures aligned with accelerated store rollout plans [F1], [S2].
Investors should note the concentrated ownership structure confers stable strategic control allowing management latitude over capital allocation decisions without disruptive shareholder intervention risk, albeit potentially limiting minority investor influence on governance matters documented publicly concerning voting agreement arrangements controlling combined voting power above majority thresholds directing corporate actions decisively [S2], [S3].
Disclaimer: This analysis is based solely on publicly available information sourced primarily from SEC filings dated through August 12, 2026, coupled with general industry knowledge applicable across the specialty coffee retail sector for analytical context purposes only without investment advice or research views offered.
Disclaimer: This is research-only, informational analysis and not investment advice. It may include AI-generated interpretation and general industry context. Always verify important details using primary sources.

Comments