
Fulton Financial Corp's 2025 Performance Highlights Acquisition-Led Growth and Return Focus
Fulton Financial leveraged strategic acquisitions and disciplined capital management in 2025 to fuel net income growth despite challenges in operating cash flow.
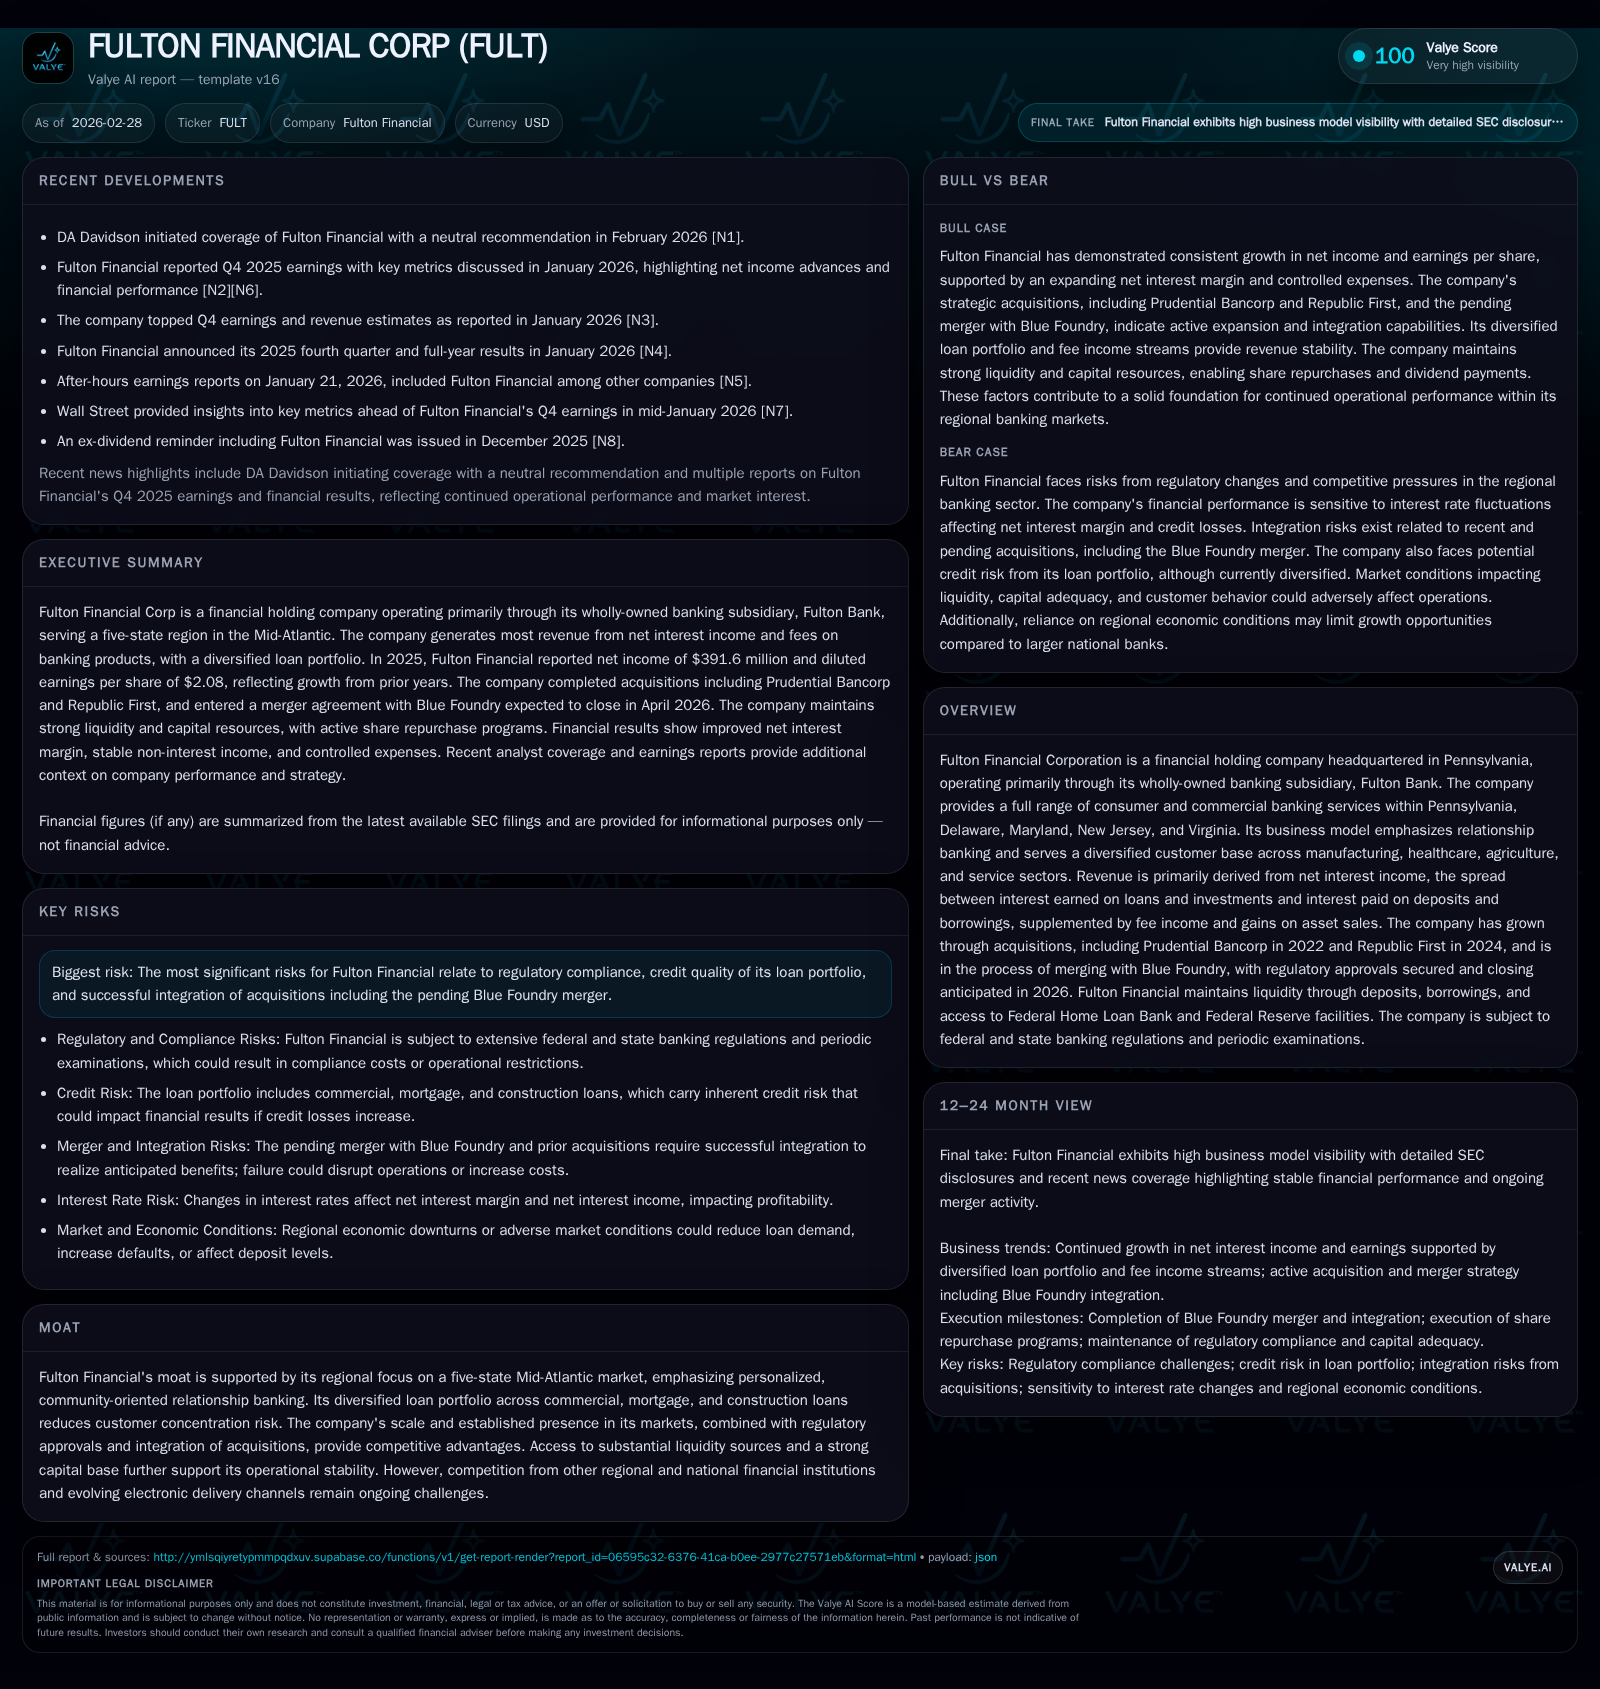
Fulton Financial Corporation, a Mid-Atlantic regional financial holding company, capitalized on key acquisitions including Republic First Bank in 2024 and an anticipated merger with Blue Foundry in 2026 to bolster earnings and expand its footprint across Pennsylvania, Delaware, Maryland, New Jersey, and Virginia. The company posted a notable 35.6% increase in net income for 2025 to $392 million, supported by margin expansion and inorganic growth. While operating cash flow declined year-over-year, Fulton maintained robust capital ratios, deployed consistent dividends, and executed sizeable share repurchases reflecting strong return-focused capital allocation. Looking ahead, successful integration of acquisitions and evolving electronic delivery channels pose principal execution risks amid a competitive regional banking environment.
Strategic Footprint and Regional Diversification
Fulton Financial Corporation anchors its operations predominantly within the Mid-Atlantic corridor—Pennsylvania, Delaware, Maryland, New Jersey, and Virginia—primarily through its wholly owned banking subsidiary, Fulton Bank [S1][S15]. The company's business model emphasizes relationship banking delivered via personalized community-oriented services. Operating within diverse economic sectors such as manufacturing, healthcare, agriculture, and service industries supports the firm's diversified loan portfolio composed of commercial loans, commercial mortgage loans, and construction loans.
Notably, no single or small handful of customers dominate the loan book sufficiently to cause material concentration risk [S1]. This reduces vulnerability to sectoral economic shocks or customer-specific defaults—a prudent risk control element in regional banking that bolsters stability.
This geographic concentration paired with sector diversification underpins FULT’s moat while exposing it to regional economic cycles and competitive pressures from other mid-sized banks expanding electronically beyond physical footprints [S15][N5].
Historical Financial Performance: Earnings Growth Driven by Acquisitions and Margin Expansion
FULT’s 2025 net income of $391.6 million represents a sharp increase of 35.6% over the prior year’s $288.7 million [F1][N3]. This uplift was chiefly attributable to incremental revenue streams from recent acquisitions alongside disciplined net interest margin management which improved slightly to approximately 3.51% in the latest fiscal year [S25].
However, contrasting the earnings growth was a noticeable contraction in operating cash flow which fell by nearly 26.9% year-over-year to $304.5 million due partly to working capital adjustments given acquisition-related costs and balance sheet changes [F1][S4]. This divergence between net income growth and cash generation warrants monitoring for sustainability.
Shareholders' equity also expanded by roughly 9.2% during the period reaching $3.49 billion as retained earnings accumulated faster than dividend payouts [F1][S20].
Historical performance (annual)
| FY | Net ($mm) | CFO ($mm) | Net YoY |
|---|---|---|---|
| 2025 | 392 | 304 | +35.6% |
| 2024 | 289 | 417 | +1.6% |
| 2023 | 284 | 363 | -0.9% |
| 2022 | 287 | 598 |
Source: SEC companyfacts cache [F1].
Capital returns and efficiency (annual)
| FY | Div ($mm) | Buybacks ($mm) | ROE% |
|---|---|---|---|
| 2025 | 141 | 66 | 11.2 |
| 2024 | 132 | 30 | 9.0 |
| 2023 | 116 | 77 | 10.3 |
| 2022 | 116 | 0 | 11.1 |
Source: SEC companyfacts cache [F1].
The table captures Fulton Financial's annual performance from FY2022-FY2025 indicating earnings surges linked to acquisitions juxtaposed with volatility in operating cash flow.
Capital Structure, Liquidity, and Funding: Leveraging Scale for Stability
Fulton maintains a well-capitalized balance sheet adhering firmly to regulatory capital requirements including CET1 capital ratios comfortably above mandated thresholds—12.6% CET1 compared with required minimums near 7%, signaling prudent capitalization [S18]. The Tier I leverage ratio near double regulatory minimum further affirms financial resilience.
Liquidity is managed conservatively through a blend of core deposits supplemented with substantial secured borrowing capacity at the Federal Home Loan Bank (FHLB). At year-end 2025 available FHLB advances were around $7.1 billion after accounting for $4.5 billion of outstanding advances/letters of credit backed by high-quality collateral like commercial/mortgage loans [S4][S13][S16].
Additionally, Fulton has collateralized borrowing facilities at the Federal Reserve Bank discount window ($3.9 billion capacity unused) and federal funds lines ($2.6 billion unused) providing contingency buffers [S4]. These multi-sourced liquidity channels offer operational flexibility against seasonal deposit outflows or credit demand spikes.
Contractual obligations worth approximately $55.6 million at December 31, 2025 mainly consist of multi-year technology outsourcing arrangements critical for ongoing IT infrastructure support fundamental to competitive digital banking services [S5].
Acquisitions Integrate Prudential Bancorp, Republic First, and Pending Blue Foundry Merger
Over recent years Fulton has pursued inorganic growth across its franchise footprint with material deals shaping its trajectory:
- Prudential Bancorp Acquisition (July 2022): Prudential Bank was merged into Fulton Bank by November that same year unlocking scale benefits primarily within Pennsylvania [S1][S15].
- Republic First Acquisition (April 2024): Expanded Fulton’s footprint regionally enhancing deposits and lending capabilities predominantly delivered under relationship banking models [S3][N3].
- Blue Foundry Merger Pending (Expected Q2/2026): With all regulatory approvals cleared as of early February ’26 and Blue Foundry shareholders having approved the transaction on January 29th ’26, this merger will boost Fulton’s presence notably upon closing approximately April 1st followed by full operational consolidation projected for Q3 ‘26 [S3][S25].
These integrations come with synergy opportunities such as cost rationalization from overlapping branches/prominent back-office platform consolidations alongside cross-selling potential due to complementary customer bases typical in regional bank rollups.
Nonetheless, integration risks persist given regulatory scrutiny common for bank mergers involving different charters plus complexity harmonizing electronic delivery platforms across previously disparate institutions [N1][N6].
Future Growth Drivers and Headwinds: Balancing Market Penetration and Execution Risks
Looking forward growth levers remain tied closely to expanding funded volume through relationship-driven lending supported by growing core deposit bases amplified by acquisition success plus steady enhancement of fee income streams from treasury management products.
Emerging challenges include competitive pressures not only from traditional regional/national banks but increasing digital-first financial services platforms pushing electronic delivery channels necessitating continued technology investments [N7][N5]. Regulatory compliance burdens heighten alongside credit risk vigilance given diversified but complex loan portfolios including construction exposures.
Execution remains crucial as Blue Foundry transaction finalizes — any unexpected costs or client attrition could dampen near-term accretion prospects per analyst commentary reflected in DA Davidson’s neutral rating initiation emphasizing cautious optimism contingent on merger milestone realizations [N6][N3].
Capital Allocation: Dividends, Share Repurchases, and Capital Return Dynamics
A hallmark of FULT’s shareholder engagement is balanced capital return aligned with sustainable earnings capture:
- Dividends steadily increased from $116 million paid in 2022 up to over $141 million in ’25 signaling commitment to yield enhancements consistent with growing retained earnings [F1][S24].
- Share repurchase programs witnessed escalation especially under the authorized $125 million buyback limit for 2025 where approximately $66 million in stock was repurchased at an average price around $18 per share adding tangible support to per-share metrics amid modest capital deployment constraints imposed on banking entities [F1][S12][S24].
- Early approval for a larger $150 million repurchase authorization covering common stock plus preferred stock/subordinated notes during FY ’26 further underscores continued focus on efficient capital stewardship backing approximately mid-teens operating returns on tangible common equity seen periodically before adjustment for goodwill amortizations [S17][N1].
A cautionary note includes observing a decline in operating cash flow juxtaposed against rising net income which requires closer attention regarding liquidity conversion efficacy under shifting macroeconomic conditions impacting borrower behavior.
Outlook Considerations: Milestones to Watch and Analyst Sentiment
Key forthcoming milestones spotlight closing of the Blue Foundry merger expected around early April Q2 ’26 followed by full legal/operational merger into Fulton Bank during Q3 ’26 as critical steps defining near-term growth trajectory execution proof points [S25][N6]. Monitoring realized synergies versus projected targets will be essential for investor confidence.
Analyst commentary from DA Davidson initiating coverage at Neutral signals tempered market expectations cognizant of integration complexity balanced against solid existing fundamentals underpinning FULT’s sizable deposit franchise and sound capital levels [N6]. Interest rate sensitivity will remain a factor given net interest margin pressure potential if funding costs rise disproportionately necessitating astute asset-liability management oversight by ALCO.[S19][S27]
Additionally,the vesting schedule of approximately 4 million shares available under employee/director equity incentive plans post-December ’25 may influence share count dynamics impacting EPS comparability cautiously.[S1]
=== DISCLAIMER: This report is prepared solely for informational purposes based on data available as of February 28, 2026; it does not constitute investment advice or recommendations regarding securities transactions.
Disclaimer: This is research-only, informational analysis and not investment advice. It may include AI-generated interpretation and general industry context. Always verify important details using primary sources.

Comments