
Oxford Square Capital Faces Portfolio Volatility and Cash Flow Challenges in 2025
The business development company contends with investment losses and pressured cash flow despite active portfolio management and capital raises.
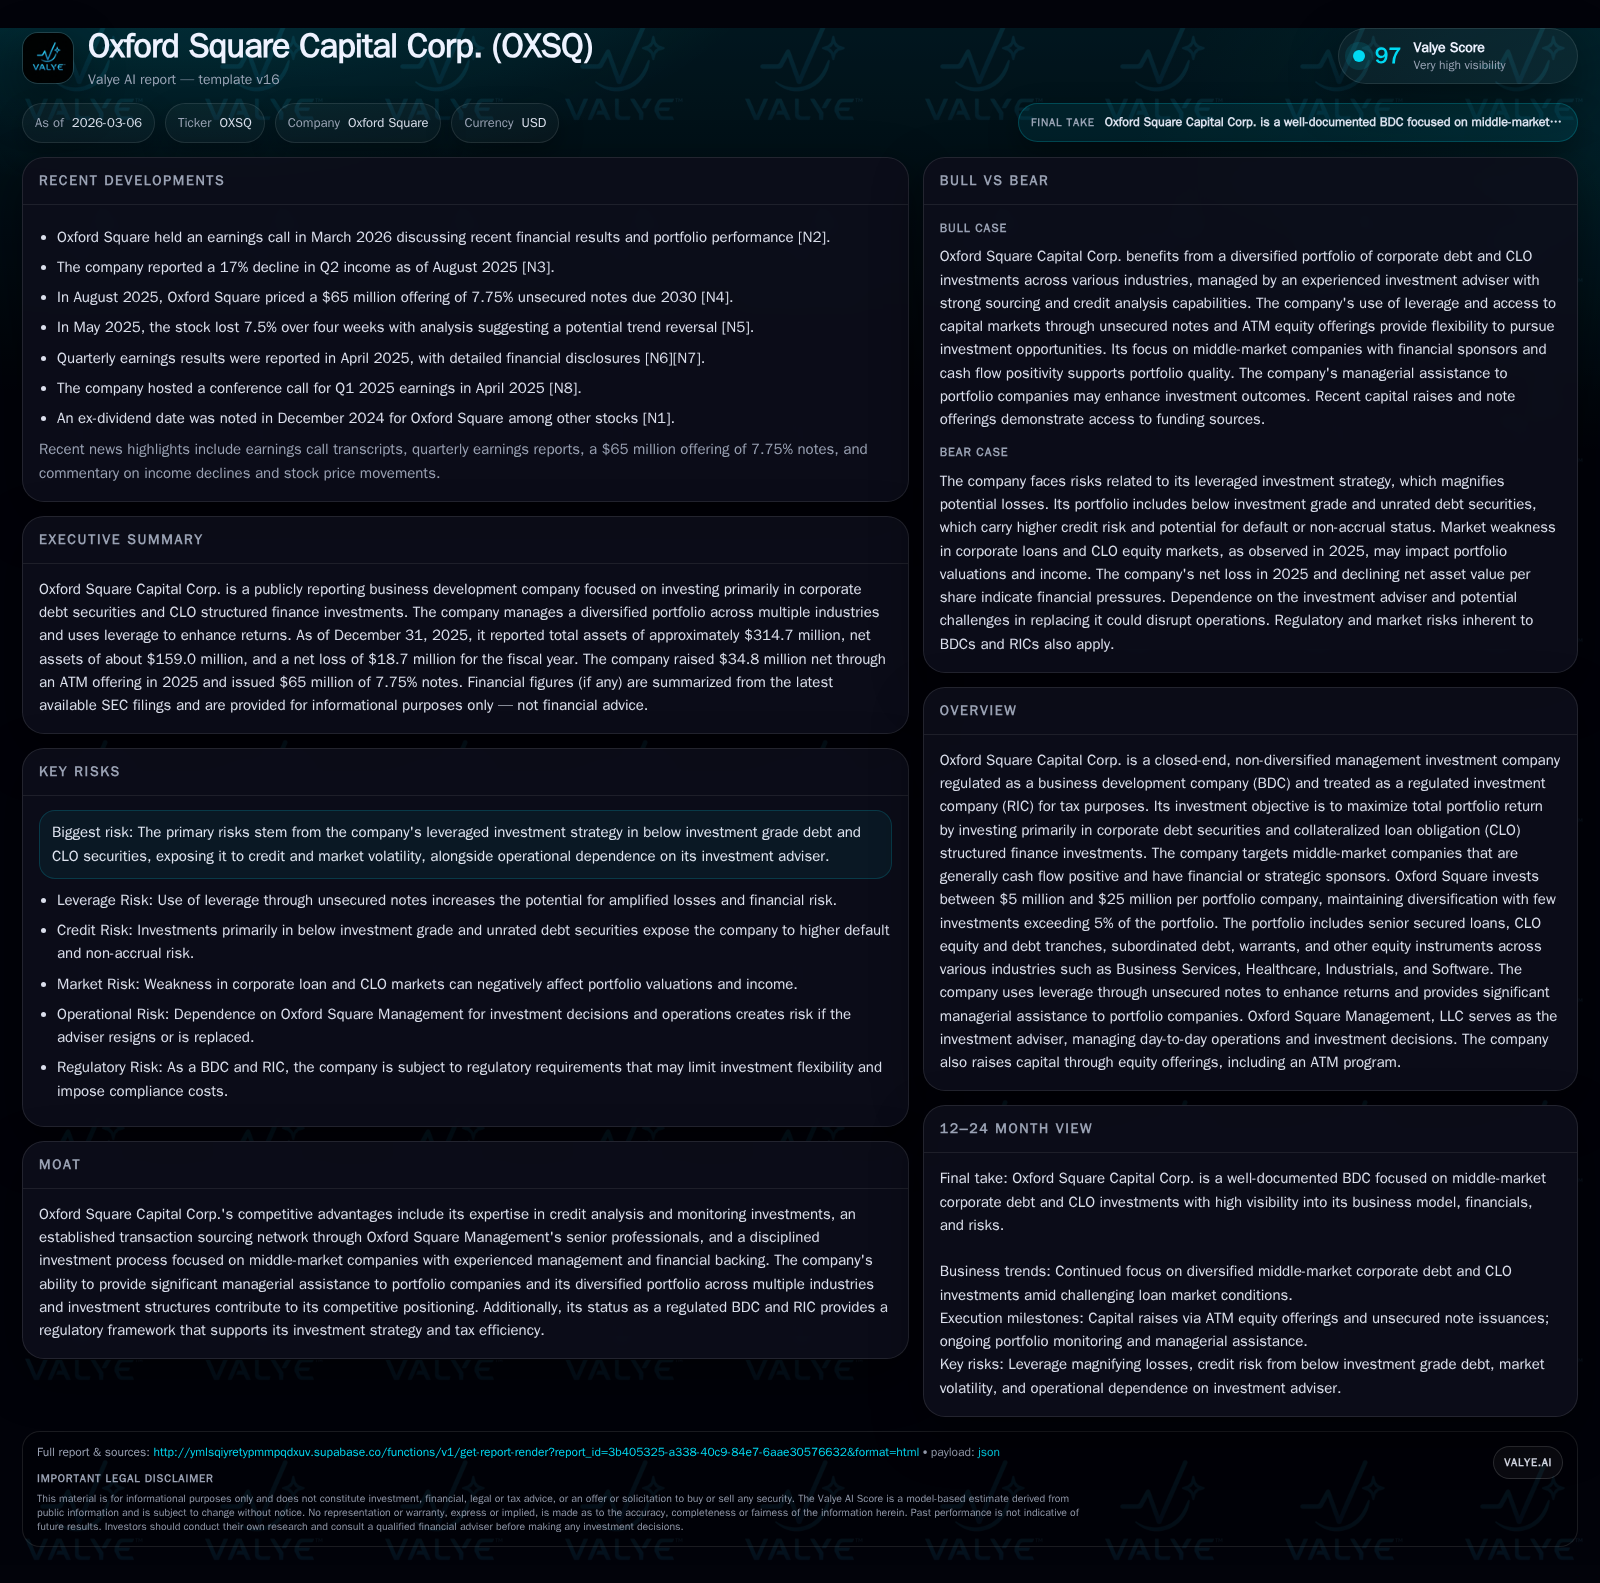
Oxford Square Capital Corp. (OXSQ) experienced a marked reversal in profitability in fiscal 2025, reporting a net loss of $18.7 million following positive earnings in prior years. This reflects credit market headwinds impacting its middle-market corporate debt and CLO equity investments, alongside significant operating cash flow declines. While the company actively managed its capital structure, including redeeming higher-cost notes and raising equity through ATM offerings, the NAV per share declined to $1.95 from $2.30 year over year. Going forward, Oxford Square’s growth hinges on market recovery, proactive portfolio surveillance, and capital deployment within its risk parameters.
Company Overview
Oxford Square Capital Corp. (OXSQ) is a closed-end management investment company regulated as a Business Development Company (BDC) that qualifies as a Regulated Investment Company (RIC) for tax purposes [S1]. Founded in July 2003 and headquartered in Greenwich, CT, it focuses on generating total portfolio returns by investing primarily in corporate debt securities and collateralized loan obligation (CLO) structured finance instruments, targeting predominantly middle-market companies with positive cash flows backed by financial or strategic sponsors.
The firm uses both fixed and variable interest rate structures across a diverse portfolio that includes senior secured loans, CLO equity/debt tranches, subordinated debt, warrants, and other equity-linked instruments spanning industries such as Business Services, Healthcare, Industrials, Software, Telecommunications, IT Consulting, Food & Beverage, Materials, and Structured Finance [S4][S21][S23].
Historical Financial Performance
Oxford Square’s recent years demonstrate volatility tied to credit market dynamics inherent to its below-investment-grade focus.
Historical performance (annual)
| FY | Net ($mm) | CFO ($mm) | Net YoY |
|---|---|---|---|
| 2025 | -19 | -14 | -418.6% |
| 2024 | 6 | 26 | -65.9% |
| 2023 | 17 | 66 | |
| 2022 | 20 |
Source: SEC companyfacts cache [F1].
Capital returns and efficiency (annual)
| FY | Div ($mm) | ROE% |
|---|---|---|
| 2025 | 31 | -12.9 |
| 2024 | 26 | 3.7 |
| 2023 | 29 | 11.4 |
| 2022 | 20 |
Source: SEC companyfacts cache [F1].
Net income plunged to a loss driven by mark-to-market impairments amid broader loan market softness; operating cash flow similarly turned negative after strong prior-year generation [F1].
Details show Oxford Square reported a net income loss of approximately $18.7 million for fiscal year ended December 31, 2025 [F1], reversing from profits of $5.9 million the prior year – an approximately fourfold decline year-over-year affected by credit losses within its portfolio sectors [F1][S1]. Operating cash flow swung sharply negative (-$13.7 million in FY25 vs +$25.7 million FY24), signaling challenges converting asset income into liquidity [F1]. The company paid out $31.3 million in dividends consistent with its RIC distribution requirements despite strained earnings [F1].
NAV per share dropped from $2.30 at the end of FY24 to $1.95 at FY25 close reflecting asset write-downs and realized losses [S11].
Investment Portfolio Composition & Strategy
Oxford Square maintains investment diversification across multiple industries with typical investments between $5 million to $25 million per company or CLO tranche [S4][S21]. As of December 31, 2025 the portfolio composition was roughly:
- Senior secured loans: ~58.5%
- CLO equity investments: ~37.8%
- Other equity & related investments: ~3.7%
The portfolio includes many middle-market firms characterized by strong or improving cash flow profiles founded on stable business models often supported by financial sponsors like private equity funds [S15][S20]. The firm adopts rigorous due diligence involving managerial quality assessment, collateral value analysis including intangible assets where applicable, financial sponsor track record review, covenant protection evaluation, and exit strategy planning including IPOs or sales [S15][S16]. Consistent with BDC regulations, Oxford Square provides managerial assistance to portfolio companies when appropriate to protect value [S5].
Its CLO exposures are mainly focused on vehicles collateralized by broadly syndicated first-lien senior secured term loans rather than real estate or consumer debt pools — presenting an investment profile aligned with loan market fundamentals but carrying leverage risks through their subordinated/junior tranches [S20][S26]. CLO equity investments can be leveraged nine to thirteen times amplifying gains or losses [S4].
Capital Structure & Liquidity Management
The company actively manages its capital structure to balance leverage with financial flexibility:
- Redeemed all $44.8 million of outstanding 6.25% unsecured notes during FY25 ahead of maturity dates as part of liability cleanup efforts [S9].
- Issued approximately $74.8 million aggregate principal amount of new unsecured notes at higher coupons (7.75%) due in July 2030 during August 2025 public offering [S9].
- Maintains outstanding approximately $80 million principal in its earlier issued lower-rate unsecured notes due through July 2028 [S9].
- Raised approximately $34.8 million net proceeds through At-The-Market (ATM) common stock offerings during calendar year ending Dec 31, 2025 enhancing equity cushion [S8][F1].
Liquidity includes over $50 million in cash equivalents plus unutilized borrowing capacity subject to regulatory limits requiring at least 70% qualifying assets under BDC rules [F1]. The management team targets maintaining portfolio liquidity adequate for potential opportunistic purchases or workouts without excessive forced selling risk [S10][N1].
Competitive Advantages & Risks
Oxford Square leverages proprietary expertise honed by senior industry veterans at Oxford Square Management who oversee investment sourcing through extensive broker/dealer networks plus active monitoring employing proprietary credit grading systems ranging from "ahead of expectations" to "requiring workout" categories for debt instruments [S10][N1]. This disciplined approach provides an edge over less-specialized lenders targeting middle-market credits.
However the company is exposed to pronounced risks:
- Investments are predominantly below-investment-grade securities carrying default probability sensitive to economic cycles.
- Leverage embedded both at the issuer CLO vehicle level and within OXSQ’s own balance sheet escalates volatility potential.
- Persistent macroeconomic headwinds including tightening credit markets have pressured loan valuations leading to unrealized depreciation indicated by NAV declines and operating results [N1][S10].
- Dependence on key personnel at the advisory firm introduces operational risk.
Forward-Looking Considerations & Milestones To Watch
While explicit near-term guidance is not detailed in filings or news transcripts [N1], critical metrics include ongoing quarterly NAV trends which will reflect credit environment changes plus whether operating cash flows revert positive indicating stabilization.
Key catalysts include:
- Ability to originate disciplined new investments selectively amid market volatility.
- Successful restructuring or exits from impaired assets to preserve capital.
- Impact of interest rate changes on floating rate debt portfolios.
- Regulatory adherence maintaining BDC eligibility supporting tax advantages.
- Efficacy of operational improvements advised through managerial assistance engagements.
- Monitoring changes in CLO market dynamics since this segment constitutes nearly 40% of invested assets; restructuring dynamics such as "CLO resets" affecting reinvestment periods could materially influence return profiles over medium term horizons [S26].
Returns & Capital Allocation Policies
Though Oxford Square has historically delivered consistent dividends aligned with RIC payout mandates, the sharp earnings decline has heightened stress on coverage ratios for distributions paid ($31+ million FY25 vs negative net income) indicating reliance potentially on capital raises or asset dispositions for dividend sustainability [F1].
Return on Equity approximated -12.9% for FY25 driven down by losses compared to previous profitable years illustrates quarter-to-quarter variability reflective of underlying credit market performance [F1].
Capital returned via dividends generally increased reflecting steady investor yield demand despite earnings pressures; share repurchases are not emphasized given limited excess capital amid restructuring efforts described [F1][N1].
Conclusion
Oxford Square Capital Corp operates within highly specialized niche credit markets focusing on middle-market corporate loans and CLO-related investments leveraging experienced advisory oversight coupled with robust deal sourcing channels underserved by traditional lenders. Its fiscal year ended December 31, 2025 evidences notable stress manifested through net losses and shrinking NAV reflecting wider leveraged loan market headwinds reverberating into below-investment-grade structured finance sectors.
Proactive redemption of older notes combined with fresh unsecured note issuance at higher cost alongside equity raises signify capital management responsiveness though not without expense.
Recovery trajectories depend heavily on stabilization within leveraged loan markets coupled with Oxford Square’s ability to monitor workouts effectively while balancing liquidity. Investors seeking exposure should observe forthcoming quarterly NAV updates along with any shifts in portfolio composition toward higher-quality assets or successful deleveraging signals.
This analysis is based solely on disclosed regulatory filings and public transcripts as of early March 2026 without forecasts or investment recommendations.
Disclaimer: This is research-only, informational analysis and not investment advice. It may include AI-generated interpretation and general industry context. Always verify important details using primary sources.
Comments