
GAP Inc. Leverages Omni-Channel Strength Amid Margin Pressures and Competitive Apparel Market
Q1 fiscal 2026 highlights operational gains tempered by tariff-driven margin contraction and demanding inventory management.
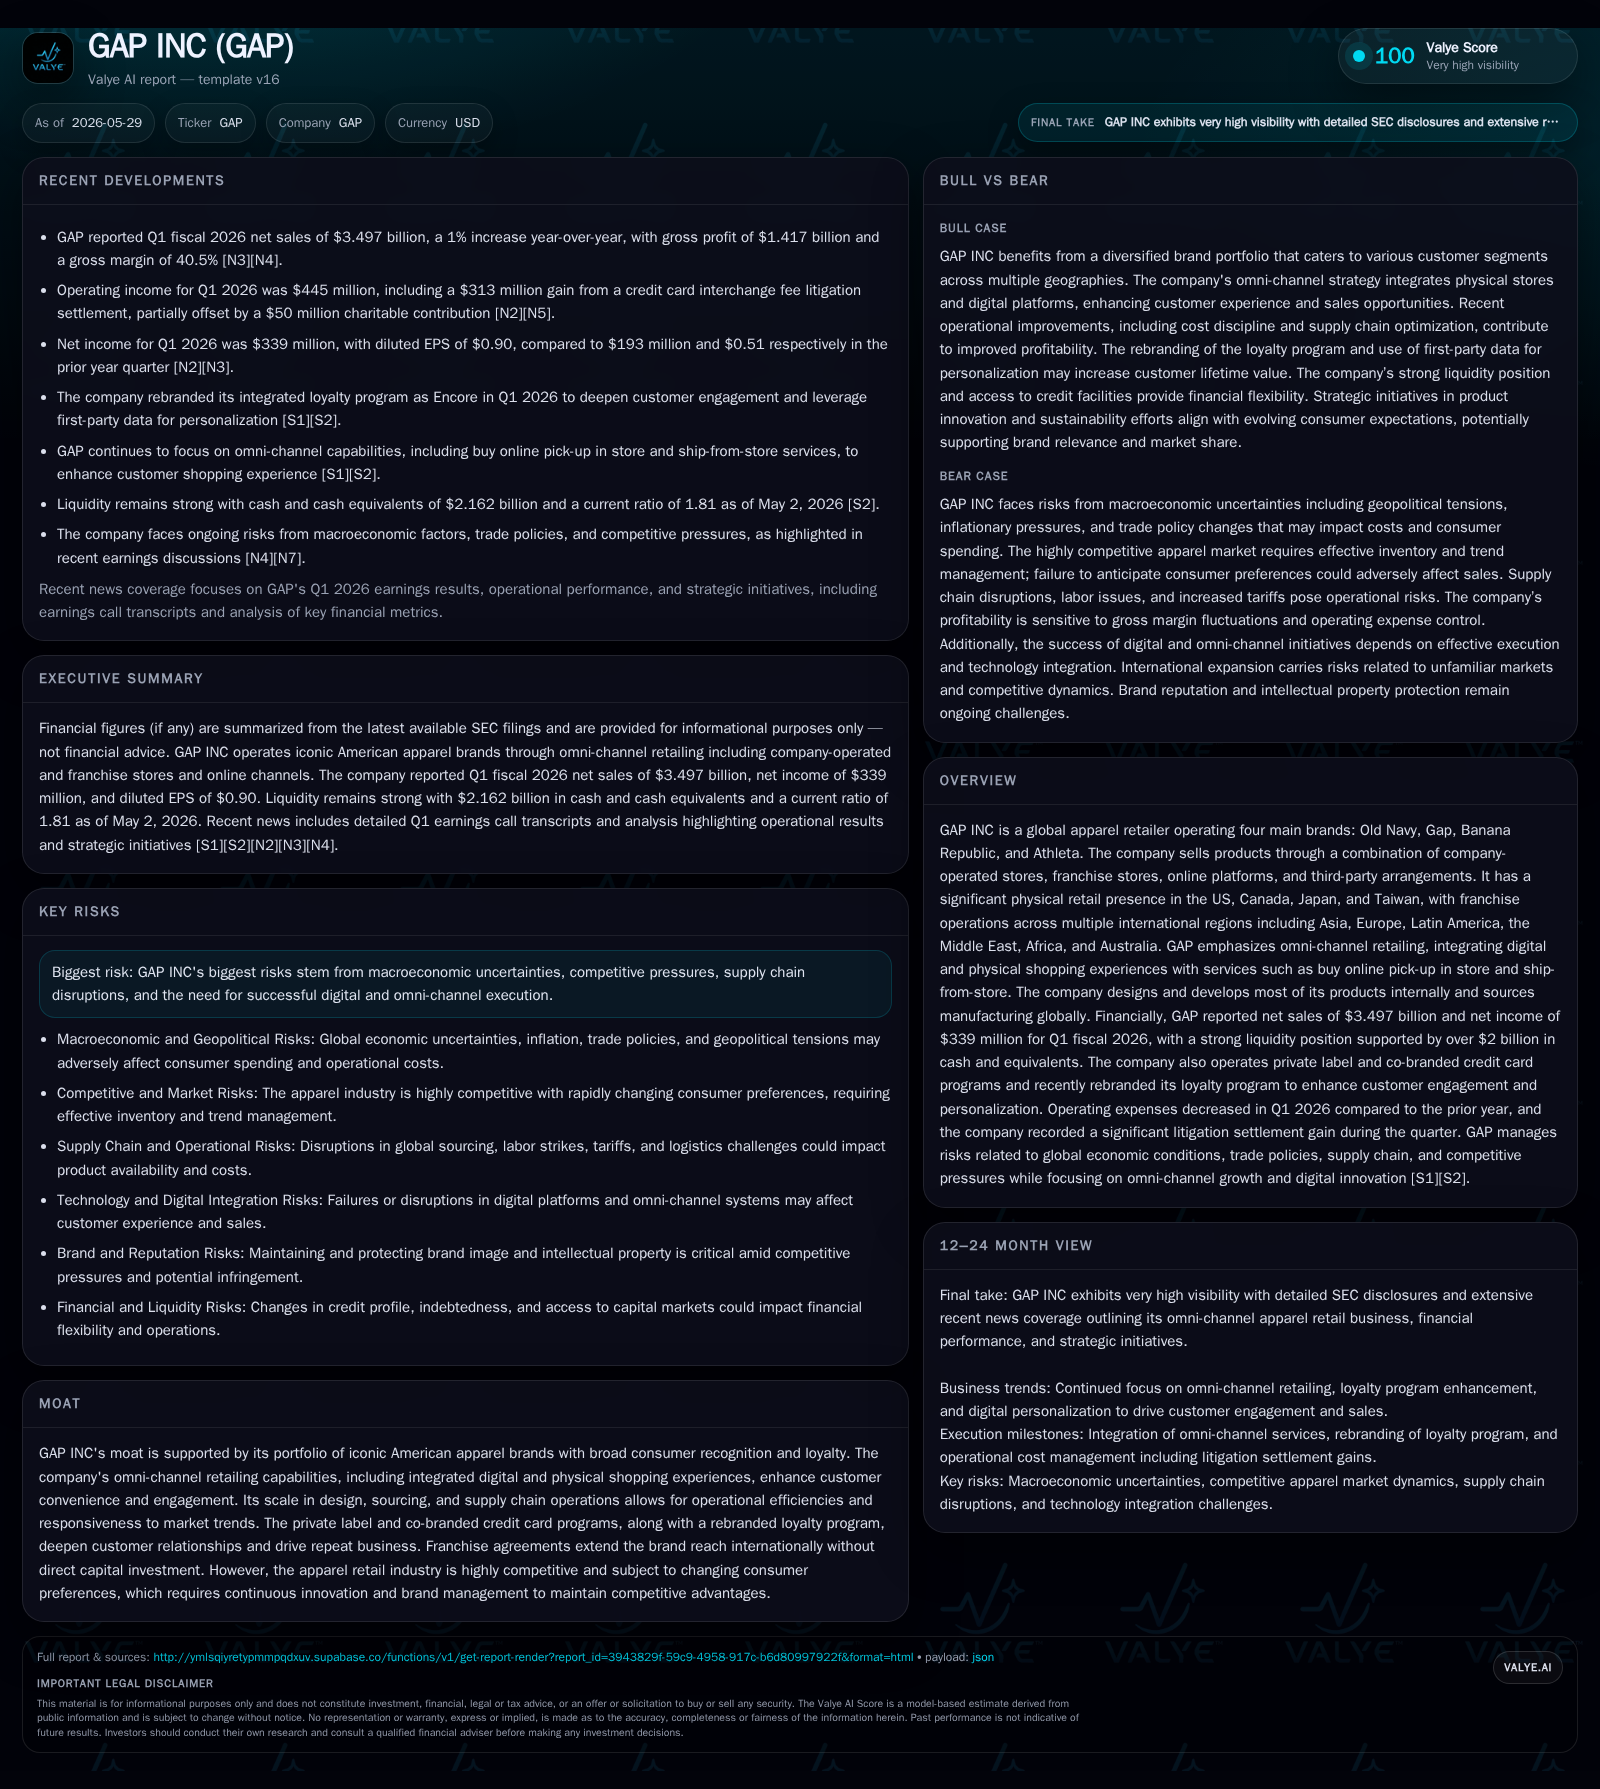
In its latest quarterly report, GAP Inc. reported a modest 1% increase in net sales driven by strong omni-channel integration but faced gross margin compression amid higher tariffs and inventory challenges. The $313 million gain from a credit card interchange fee litigation settlement bolstered operating income, yet underlying apparel market competition and consumer preference shifts remain key risks. GAP’s diversified brand portfolio and global franchise model provide scale and reach, but structural pressures in sourcing costs and digital execution will define near-term growth trajectories.
Recent Operating Update
GAP Inc.’s first quarter fiscal 2026 filing dated May 29, 2026 ([S2]) presents a cautious yet constructive snapshot of operations during a challenging apparel retail environment. Net sales increased marginally by 1% versus the prior year quarter, signaling stable customer demand despite widespread sectoral competition. However, this top-line resilience masks pressure points: gross profit declined from $1.45 billion to $1.42 billion while gross margin slipped from 41.8% to 40.5%. This compression primarily reflects elevated tariffs imposed under evolving US trade policies coupled with shifting inventory costs bolstered by tariff rate adjustments ([S4], [S25]).
Operating income was notably buoyed by a one-time litigation settlement gain of $313 million related to credit card interchange fees (net of legal expenses), partially offset by a $50 million charitable contribution. Without this gain, the operational profitability narrative would be less robust but still positive considering tight cost controls ([S2]). Net income rose sharply to $339 million from $193 million year-over-year.
The firm continues emphasizing omni-channel integration as a strategic pillar fostering seamless shopping across its brand suite via initiatives like buy online pick-up in store (BOPIS), ship-from-store fulfillment, and enhanced mobile experiences—key enablers for driving traffic both digitally and physically during changing customer behaviors ([S4]).
Business Model
At its core, GAP Inc. functions as a multi-brand apparel retailer delivering product through multiple channels: company-operated stores predominantly in North America (US, Canada), Japan, Taiwan; franchise operations internationally; digital direct-to-consumer platforms; plus third-party arrangements leveraging brand licenses ([S1]). Revenue is generated principally via merchandise sales paid upfront or through credit card programs co-branded with financial partners—evidenced by the recent legal settlement linked to credit card interchange fees.
Costs are largely influenced by design and development internally managed but reliant on global third-party manufacturing partnerships spread across varied geographies ([S1]). Pricing mechanisms depend on seasonal collections aligning with volatile fashion trends—a key challenge given the risk of misjudging consumer preferences leading to markdowns or excess inventory ([S2], [S1]). The company’s focus on operational rigor entails disciplined inventory management coupled with supply chain efficiencies aimed at mitigating tariff effects and delivery lead times.
Margins are subject to fluctuations driven by raw material costs, tariff impositions changing input prices abruptly, and dynamic selling price adjustments necessary to maintain brand competitiveness without eroding pricing power ([S4], [S25]). EBITDA benefits moderately from scale economies achieved through shared investments in IT infrastructure supporting omni-channel capabilities and supply chain automation.
Industry Structure and Competitive Position
GAP Inc. operates within the highly competitive global apparel retail industry characterized by fast-changing consumer tastes, intense pricing battles from fast fashion players (e.g., Zara/Inditex) and specialty retailers (e.g., Abercrombie & Fitch), plus e-commerce pure plays aggressively expanding market share ([N6]). This sector demands agility in trend responsiveness combined with balance sheet discipline due to capital-intensive store operations coupled with growing digital investment needs.
The company’s portfolio blends mid-tier mass-market appeal (Old Navy) with more premium segments (Banana Republic) while increasingly focusing on activewear through Athleta—capitalizing on health-conscious consumer trends that could underpin structural growth avenues ([S1]). Its broad geographic footprint via corporate stores supplemented by franchises abroad provides diversified revenue streams but introduces complexities in managing regulatory regimes and local market preferences.
Omni-channel integration is an indispensable competitive advantage allowing GAP to capture shoppers transitioning between online touchpoints and brick-and-mortar formats effectively—raising switching costs while enhancing lifetime value through loyalty program synergies linked to proprietary credit arrangements ([S1]). However, the persistence of tariff uncertainties coupled with macroeconomic headwinds continue exerting pressure on sourcing strategies compared to nimbler competitors employing vertically integrated supply chains or localized production models.
Growth Drivers
Omni-Channel Expansion
GAP’s continued investments in digital infrastructure supporting seamless channel crossover capitalize on consumer demand for convenience across shopping journeys (BOPIS, ship-from-store). This drives incremental volume via cross-selling among its brand family while maximizing asset utilization of physical stores as fulfillment hubs ([S4]).
Brand Relevance Enhancement
Focused marketing initiatives aimed at rejuvenating core brands seek to maintain relevance among evolving demographic cohorts. Innovations in product design aligned with contemporary fashion trends combined with targeted advertising campaigns underpin growth prospects particularly for Old Navy’s mass appeal segment ([S22]).
Supply Chain Optimization
Efforts to improve responsiveness through shared technology platforms enable agile inventory allocation reducing markdown risk amidst fluctuating tariffs. Global manufacturing partnerships are evaluated continuously for cost efficiencies balancing quality standards without jeopardizing brand integrity ([S22], [S25]).
International Franchise Expansion
Leveraging franchising allows scalable global penetration without proportional capital expenditure — critical for accessing emerging markets’ growth potential amid rising disposable incomes ([S1]).
Risks / Watchpoints / Growth Constraints
Tariff Volatility Impacting Margins
Frequent changes in US trade policies impose unpredictability on landed costs of goods influencing profitability unless managed via price adjustments or alternate sourcing ([S4], [S25]).
Consumer Preference Shift Risks
Failure to swiftly interpret fashion trends or react ahead of competitors risks excess inventory accumulation necessitating discounting that erodes margins ([S2], [S1]).
Supply Chain Disruptions
Global manufacturing dependencies expose operations to geopolitical tensions or logistical setbacks potentially delaying product availability impacting sales continuity ([S15]).
Digital Execution Complexity
While omni-channel investments promise growth leverage points, failure to execute seamless integration or efficiently convert online traffic could undermine expected returns on technology spend.
Competitive Pressure Intensity
Apparel retail is densely populated; peer firms aggressively pursuing value positioning or specialty niches may reduce GAP’s share absent strategic differentiation.
What to Watch Next
- Developments surrounding US trade policies and tariff revisions affecting input costs visible in successive quarter gross margins. - Progression in digital platform metrics including online sales growth rates relative to overall revenue expansion signaling omni-channel adoption success. - Inventory levels trending relative to sales indicating effectiveness of merchandise planning against trend risk exposure. - International franchise performance updates revealing success scale potential amidst geopolitical/regulatory nuances. - Quarterly earnings disclosures providing updates on operating leverage post-settlement-event juxtaposed with baseline retail profitability. - Marketing campaign impact on brand resonance measured through engagement KPIs outlined during earnings commentaries [N2][N3]
Financial Profile Summary (Latest Quarter)
As of May 2, 2026 end-of-quarter balance sheet data reflects robust liquidity standing with cash & equivalents totaling approximately $2.16 billion overshadowing total debt near $1.49 billion (comprising senior notes maturing in 2029 and 2031 at fixed interest rates around 3.6%-3.9%) resulting in net cash position supportive of ongoing capex needs and shareholder distributions ([F1], [S13]). Current ratio is solidly above 1.8x underscoring short-term solvency.[F1]
Disclaimer
This analysis is intended solely for informational purposes based strictly on publicly available regulatory filings and news sources as cited; it does not constitute investment advice or research views regarding GAP Inc.'s securities.
Disclaimer: This is research-only, informational analysis and not investment advice. It may include AI-generated interpretation and general industry context. Always verify important details using primary sources.

Comments