
Great Lakes Dredge & Dock Sustains Profit Recovery with Strategic Capital Moves Despite Revenue Pressure
GLDD leverages specialized assets and government contracts while managing liquidity and debt amid uneven top-line trends.
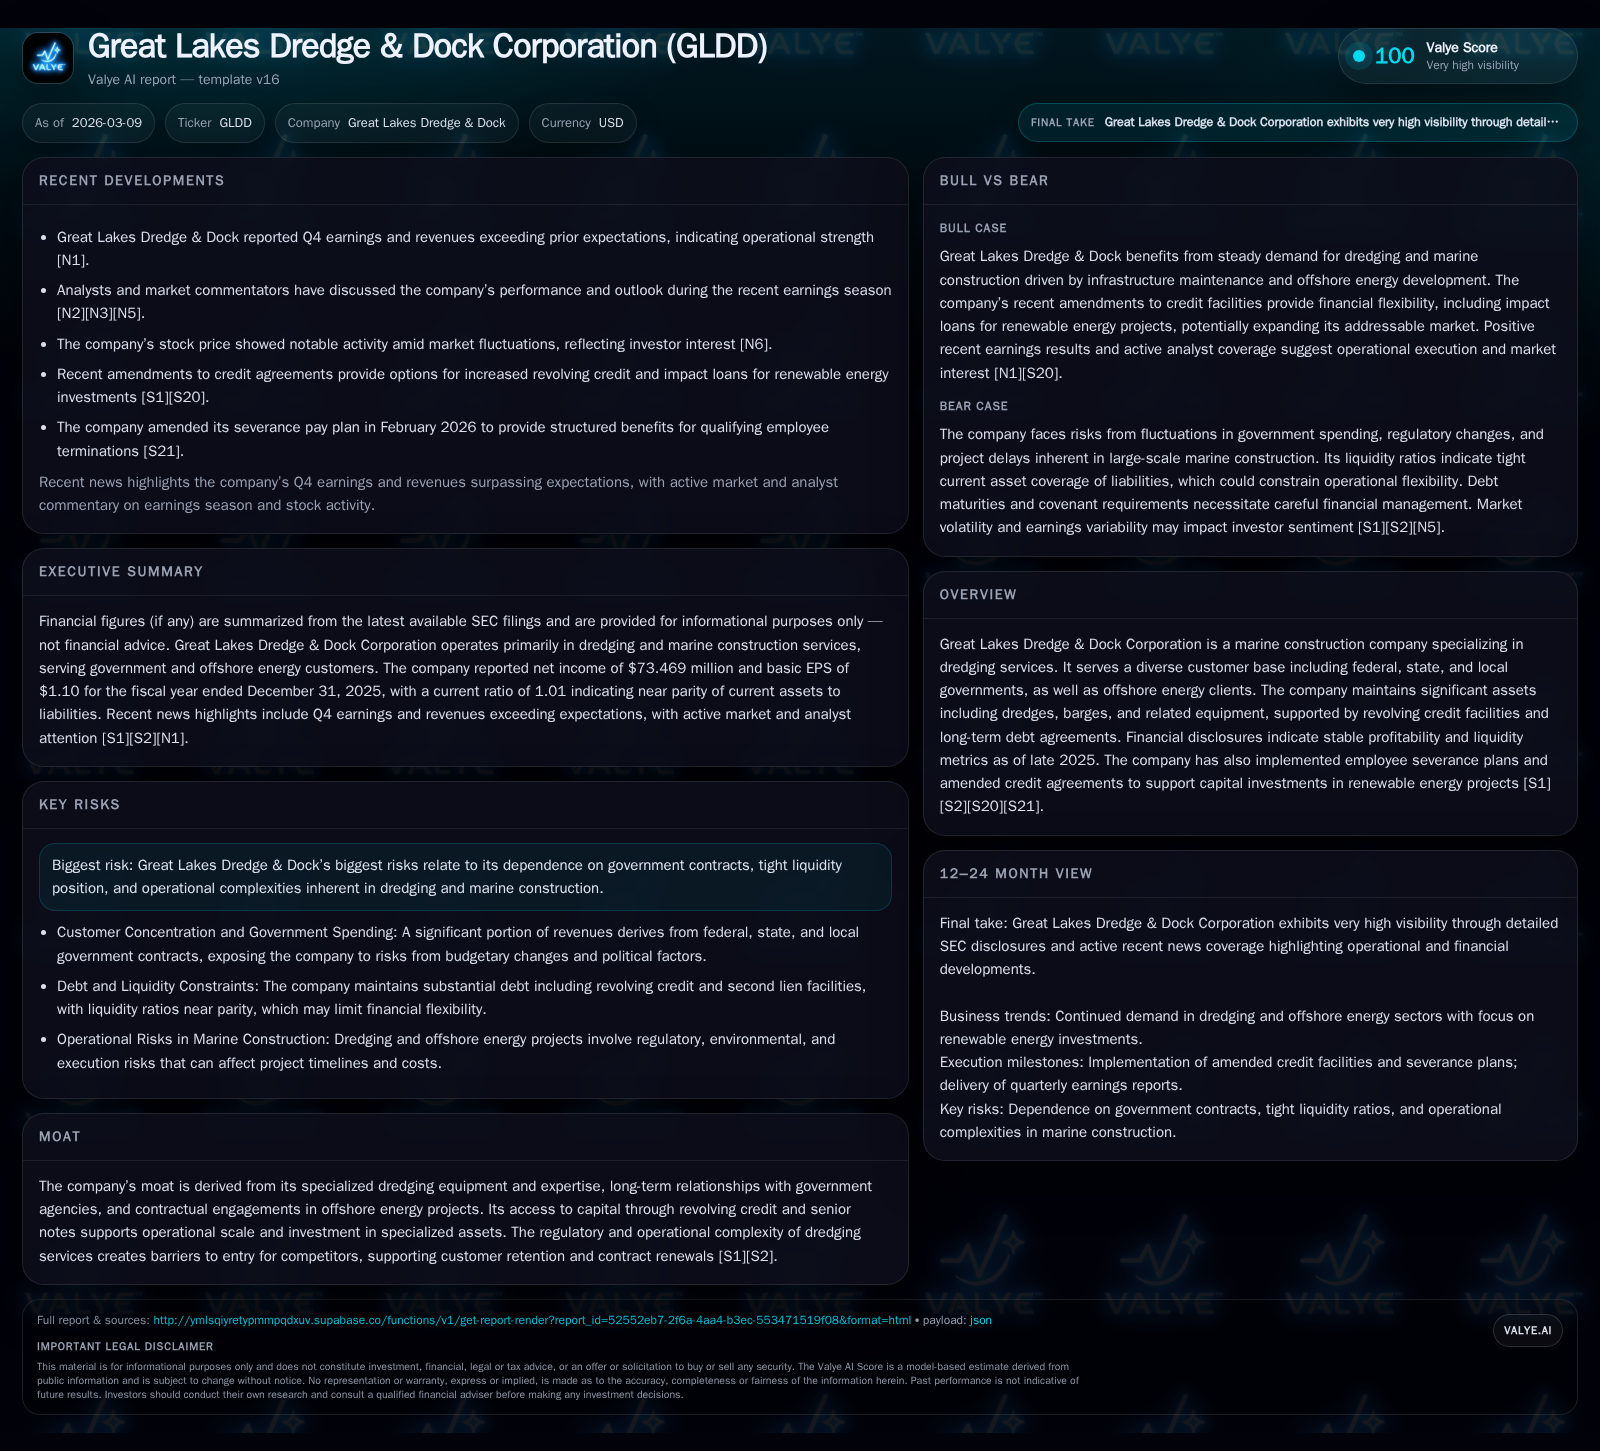
Great Lakes Dredge & Dock Corporation (GLDD) demonstrated a notable rebound in operating income and net profit in 2025, marking a turnaround from prior losses experienced in 2022. Despite a contraction in revenue compared to earlier years, the company’s strategic focus on capital investment and leveraging revolving credit facilities underpins operational resilience. GLDD’s niche dredging expertise and longstanding government relationships provide a competitive moat, but dependence on public sector projects poses inherent risks. The firm’s disciplined capital allocation emphasizes sustaining free cash flow generation while cautiously navigating leverage and investment in renewable energy-related assets.
Historical Performance
Great Lakes Dredge & Dock Corporation (GLDD) has experienced significant volatility over the past decade in its revenue and profitability alongside shifts in sector demand. The firm posted peak revenues above $850 million during FY2015 but has since trended downward, with reported revenue at approximately $702.5 million for FY2017 [F1]. More recently, revenue continues to reflect a retreat from those historical highs though remains substantial given the company's niche market position.
Profitability mirrored this pattern with operating income swinging from negative territory (-$27.7 million operating loss in FY2022) back into solid positive performance ($127.8 million operating income by FY2025), marking a sharp recovery driven by cost management and potentially improved contract mix [F1]. Net income similarly rebounded from a net loss of -$34.1 million in FY2022 to $73.5 million profitability in FY2025.
Operating cash flow normalized strongly post-2022 weakness rising 252% year-over-year to nearly $247 million by end-2025 while capital spending has remained elevated around $147 million annually to support asset upgrades and expansions [F1]. Equity grew steadily reflecting retained earnings accumulation and moderate capital returns.
Historical performance (annual)
| FY | Net ($mm) | CFO ($mm) | OpInc ($mm) | Capex ($mm) | Net YoY |
|---|---|---|---|---|---|
| 2025 | 73 | 247 | 128 | 147 | +28.3% |
| 2024 | 57 | 70 | 93 | 125 | +311.8% |
| 2023 | 14 | 47 | 28 | 151 | +140.8% |
| 2022 | -34 | 2 | -28 | 143 |
Source: SEC companyfacts cache [F1].
Capital returns and efficiency (annual)
| FY | Buybacks ($mm) | FCF ($mm) | ROE% |
|---|---|---|---|
| 2025 | 12 | 99 | 14.2 |
| 2024 | -55 | 12.8 | |
| 2023 | -103 | 3.6 | |
| 2022 | 4 | -141 | -9.2 |
Source: SEC companyfacts cache [F1].
Revenues not available for recent years beyond FY2017 snapshot; growth percentages assume latest available data.
Future Growth Prospects
Great Lakes Dredge & Dock’s growth trajectory depends heavily on its ability to secure new contracts primarily with federal, state, and local governments as well as offshore energy companies [S1]. The government's commitment to infrastructure improvements in ports, coastal restoration, beach nourishment, and climate resiliency projects can serve as key demand drivers.
Additionally, GLDD has actively engaged renewable energy projects linked to offshore wind and clean transportation capital expenditures which are supported by its green loan financing arrangements offering reduced borrowing costs contingent upon compliance with environmental investment criteria [S7][S9].
The company's asset base—specialized dredge vessels and marine construction equipment—is critical for retaining competitive advantage due to the high barriers of entry associated with technical complexity and regulatory requirements [S1]. However, reliance on government budgets exposes GLDD to risk from funding delays or policy shifts that could cap near-term order flow.
Furthermore, working capital must be carefully managed due to project-based revenues which often experience timing fluctuations.
Forecasts / Milestones / Expectations
While explicit forward guidance is not detailed publicly as of the latest filings and news releases [N1][N3], key milestones include continued deployment of dredging assets across ongoing beach nourishment contracts and offshore wind developments underpinned by supportive credit agreements [S20].
Investors should monitor backlog levels disclosed periodically as an indicator of future revenue visibility as well as any amendments or extensions of revolving credit facilities that underpin liquidity [S9][S13].
Fuel price hedges provide some protection against volatility impacting operating margins given fuel is a major cost component for dredging operations [S1].
Management’s execution on cost controls observed between FY2023–FY25 improving operating leverage will remain crucial especially if revenue pressures persist.
Returns / Capital Allocation
GLDD’s approximate return on equity for FY2025 stands at about 14%, measured by dividing net income ($73.5 million) by average equity (approximately $517 million) as per the most recent balance sheet data [F1]. This reflects moderate profitability consistent with an asset-intensive industrial business.
The company generated significant free cash flow estimated at roughly $99.5 million for FY2025 (operating cash flows minus capex), indicating strong internal funding capability despite substantial reinvestment needs [F1].
Modest share repurchases have resumed with $11.6 million spent during FY2025 supporting shareholder returns without compromising liquidity too aggressively given covenant constraints discussed below [F1].
On the debt front, GLDD operates under a senior secured revolving credit facility increased recently from $300 million to $330 million with provisions incentivizing green loans tied to renewable energy capital projects—reflecting strategic alignment with ESG trends [S9][S12][S13]. The second lien term loan of $100 million carries weighted average interest near or above 12%, representing one of the higher-cost funding sources secured by vessel assets and accounts receivable collateral [S14][S16][S25]. These debt instruments come with covenants including minimum liquidity thresholds influenced by fixed charge coverage ratios that could pressure flexibility if earnings falter [S6][S10].
Capital allocation priorities currently emphasize maintaining operational scale through asset investments while balancing debt service obligations amid cyclical project funding dynamics.
Moat Analysis
The company’s competitive advantage is grounded in both tangible assets—namely its fleet of specialized dredging vessels—and intangible factors like established long-term governmental relationships that facilitate contract renewals amidst high regulatory hurdles for new entrants [S1][S2]. The marine construction industry imposes significant licensing requirements plus environmental compliance complexities which restrict rapid commoditization or competition.
Furthermore, involvement in offshore energy sectors aligns GLDD with growth markets such as offshore wind farm development where technical knowledge intertwines with regulatory navigation skills.
These elements combined create effective barriers against smaller competitors lacking capital intensity or certification pedigree.
Risk Factors
However prudent management must continually oversee concentration risks stemming from heavy dependence on public sector contracts that are subject to budgetary whims or political priorities potentially delaying award cycles or payment timings [S1]. Liquidity position requires vigilance due to covenant-driven minimum cash thresholds coupled with debt servicing costs notably influenced by relatively expensive second lien loans averaging circa double-digit interest rates [S14][S25]. Additionally operational risks inherent in complex dredging projects encompass weather disruptions, environmental regulation changes, vessel maintenance demands, and labor considerations including severance plans enacted previously [S21].
External forces such as fluctuations in energy prices impact input cost structures while market conditions affecting offshore energy sector investment may indirectly influence contract pipeline strength.
Conclusion: What to Watch Next (Analysis)
Given the absence of explicit future guidance, stakeholders should observe quarterly updates detailing backlog size changes as these will convey order momentum particularly relating to government-funded coastal infrastructure programs versus private offshore energy contracts.
Fuel price hedging effectiveness remains a metric tied closely to margin stability under variable operating conditions.
Furthermore monitoring utilization rates of revolving credit lines vis-à-vis covenant compliance thresholds can signal financial flexibility before stress points ensue.
Capital expenditure patterns alongside announcements regarding renewable-focused asset deployments will illustrate management's commitment toward strategic transformation aligned with environmental trends.
Finally share repurchase pace may offer insights into confidence levels regarding sustained free cash flow generation amidst evolving macroeconomic challenges within the marine construction industry.
This analysis is based solely on publicly available information including SEC filings up to early March 2026 and related market disclosures without offering investment advice or recommendations.
Disclaimer: This is research-only, informational analysis and not investment advice. It may include AI-generated interpretation and general industry context. Always verify important details using primary sources.
Comments