
Chart Industries: Growth and Challenges in Gas and Liquid Molecule Technologies
Chart Industries leverages technical expertise and recent acquisitions to expand its clean energy footprint, yet faces cyclical demand and merger execution risks.
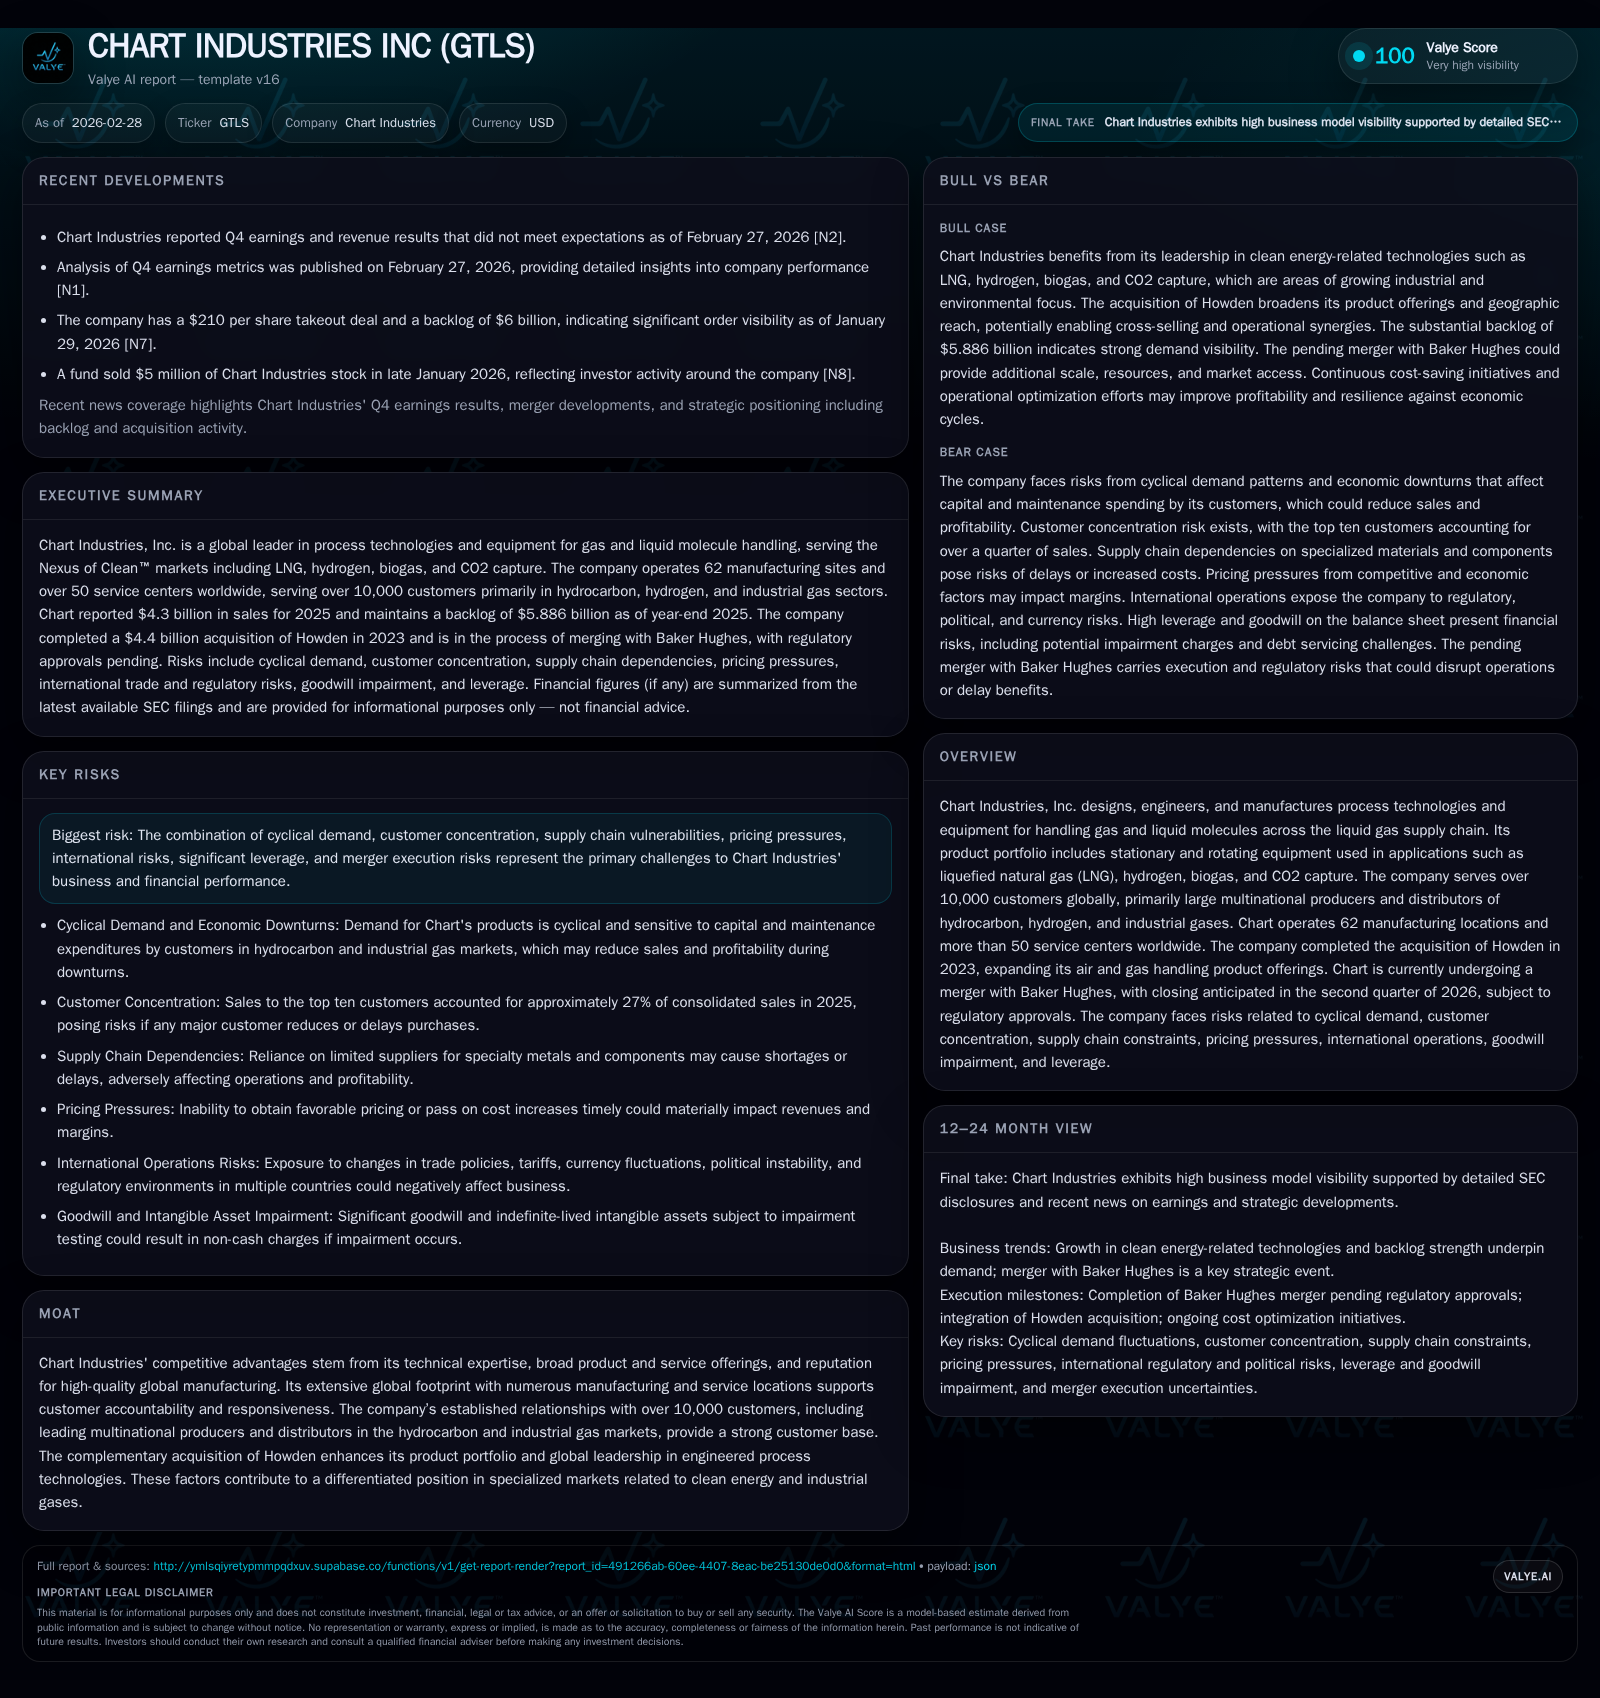
Chart Industries, a global leader in engineered process technologies for gas and liquid molecule handling, has experienced solid revenue growth driven partly by its $4.4 billion acquisition of Howden in 2023. However, operating income and net income declined markedly in 2025 amid cost pressures and integration challenges. The company faces significant cyclicality linked to large multinational customers concentrated in hydrocarbon and industrial gas markets, which impacts forecasting and profitability. Chart is preparing for a pending merger with Baker Hughes expected to close in Q2 2026, presenting both strategic opportunities and execution risks. Capital allocation remains cautious given leverage constraints, with positive free cash flow but modest returns on equity.
Historical Growth Patterns and Operating Performance Dynamics
Chart Industries reported steady top-line expansion over the last three fiscal years, with revenues growing from $3.4 billion in FY2023 to $4.3 billion in FY2025, representing an annual increase of approximately 15.1%, supported by organic growth and the integration of the Howden acquisition completed in early 2023 [F1][S1]. Despite this growth, operating income peaked at $647.5 million in FY2024 before declining by 44.6% to $358.4 million in FY2025 [F1]. This contraction reflects margin pressures likely stemming from integration expenses, pricing dynamics, and elevated costs post-acquisition.
Net income also experienced a steep decline of over 81%, falling from $218.5 million in FY2024 to $40.7 million in FY2025 [F1], indicative of non-recurring charges such as impairments or merger-related expenses that substantially eroded profitability.
Operating cash flow contracted by about 41.8% year-over-year to $292.7 million while capital expenditures were reduced by roughly a quarter to $89.9 million [F1], demonstrating conscious capital management amid fluctuating profitability.
Acquisition of Howden: Expanding Product Capabilities and Market Reach
The strategic acquisition of Howden for $4.4 billion fortified Chart’s technological breadth by adding mission critical air and gas handling products to its existing cryogenic equipment portfolio across LNG, hydrogen, biogas, and CO2 capture segments [S1][N8]. This diversification enhances Chart’s exposure within the Nexus of Clean(TM), enabling entry into adjacent markets complementing offerings like brazed aluminum heat exchangers and liquefaction systems.
Howden's established service networks expand Chart's manufacturing footprint—now encompassing 62 manufacturing locations and over 50 service centers globally—improving customer responsiveness across multiple geographies [S1]. The combined entity aims to leverage overlapping customer relationships among large multinational producers and distributors of hydrocarbon and industrial gases.
Cyclical Demand and Customer Concentration Risks Impacting Revenue Streams
Chart’s revenue profile remains exposed to cyclicality inherent in capital expenditures among major energy sector customers who accounted for approximately 27% of total revenues through the top ten customers in FY2025, highlighting material concentration risk [S4]. These customers’ spending patterns are historically susceptible to fluctuations driven by global economic conditions, energy price volatility, and project timing adjustments.
Such cyclicality complicates accurate long-term forecasting; despite some order growth through 2025, energy market swings led customers to delay or reschedule projects affecting backlog visibility [S4]. Customer consolidation trends further increase dependency on fewer entities whose purchasing discretion materially impacts financial outcomes.
Operational Efficiency Efforts and Cost Management Initiatives
In response to rising costs post-Howden acquisition and ongoing economic uncertainties, Chart has implemented continuous cost savings initiatives aiming to better align fixed overhead with prevailing demand levels across its manufacturing network [S1]. Success depends critically on timely adjustments particularly within supply chains involving specialty metals such as special grades of aluminum used in brazed aluminum heat exchangers—a key segment vulnerable to supplier concentration risks [S10].
Efficient resource allocation across diverse production sites will be essential; failure risks further margin erosion beyond the significant drop observed in FY2025 operating profits.
Implications of the Pending Baker Hughes Merger: Synergies and Integration Risks
Chart is positioned at an inflection point with its pending merger agreement with Baker Hughes announced mid-2025, subject to expected closing during Q2 2026 following regulatory clearances [S2][S3]. This transaction promises an expanded technology leadership role across engineered process technologies relevant for clean energy transitions.
However, merger execution risks include potential regulatory delays or imposed conditions affecting benefits; integration complexities given scale differences; ongoing transaction-related expenses regardless of deal completion; and shareholder litigation challenging disclosure adequacy that could delay closure or complicate proceedings [S18][S20][S23].
Market perception around these uncertainties may impact internal confidence among employees and external confidence among customers influencing order momentum during this transition period.
Capital Allocation Strategy: Cash Flow, Capital Expenditures, and Shareholder Returns
Chart’s financial stewardship reflects cautious capital deployment underpinned by indebtedness totaling approximately $3.7 billion as of end-2025 per SEC filings [F1][S12]. The company generated operating cash flow near $293 million against capital expenditures around $90 million resulting in positive free cash flow near $203 million for FY2025 [F1], providing internal funding flexibility.
Return metrics remain subdued with an approximate ROE of only 1.3%, calculated using latest net income relative to equity base near $3.23 billion [F1], placing pressure on capital efficiency expectations especially for buy-side investors focused on returns quality.
Dividend payments or share repurchases are not prominently disclosed indicating a conservative posture likely influenced by leverage covenants restricting distributions until deleveraging objectives are met [F1][S12]. This prudence balances ongoing investment needs alongside preparing for Baker Hughes integration demands.
Key Financial Metrics at a Glance: Profitability, Liquidity, and ROE Trends
Historical performance (annual)
| FY | Net ($mm) | CFO ($mm) | OpInc ($mm) | Capex ($mm) | Net YoY |
|---|---|---|---|---|---|
| 2025 | 41 | 293 | 358 | 90 | -81.4% |
| 2024 | 219 | 503 | 648 | 121 | +361.9% |
| 2023 | 47 | 167 | 391 | 136 | +97.1% |
| 2022 | 24 | 81 | 152 | 74 |
Source: SEC companyfacts cache [F1].
Capital returns and efficiency (annual)
| FY | FCF ($mm) | ROE% |
|---|---|---|
| 2025 | 203 | 1.3 |
| 2024 | 382 | 7.7 |
| 2023 | 32 | 1.7 |
| 2022 | 7 | 0.9 |
Source: SEC companyfacts cache [F1].
Revenues show consistent expansion while profits exhibit volatility linked mainly to acquisition effects.
Forward-Looking Considerations: Market Position, Regulatory Approvals, and Execution Risks
Early-2026 marks a crucial phase as Chart awaits final regulatory approvals for its Baker Hughes merger expected during Q2; any delays could impose additional costs or disrupt financial performance plans [S2][N1][N2][S23].
Energy market volatility continues influencing project timings among major customers whose capital spending schedules directly drive Chart’s order intake—a source of ongoing forecast uncertainty [S4]. Supply chain constraints involving premium materials remain potential bottlenecks affecting delivery schedules.
Shareholder litigation challenging merger disclosures adds legal complexity that could defer or complicate closure timelines raising operational distractions [S18]. Heightened leverage necessitates vigilant cash flow management ensuring covenant compliance while financing strategic initiatives.
Monitoring these factors is essential through the merger execution window shaping risk-adjusted expectations for Chart’s trajectory within engineered process technologies central to clean energy solutions worldwide.
Disclaimer: This analysis is based solely on publicly available data points cited herein without offering any investment recommendations.
Disclaimer: This is research-only, informational analysis and not investment advice. It may include AI-generated interpretation and general industry context. Always verify important details using primary sources.
Comments