
Mammoth Energy Services Executes Strategic Divestitures to Refocus Amid Cyclical Oilfield Pressures
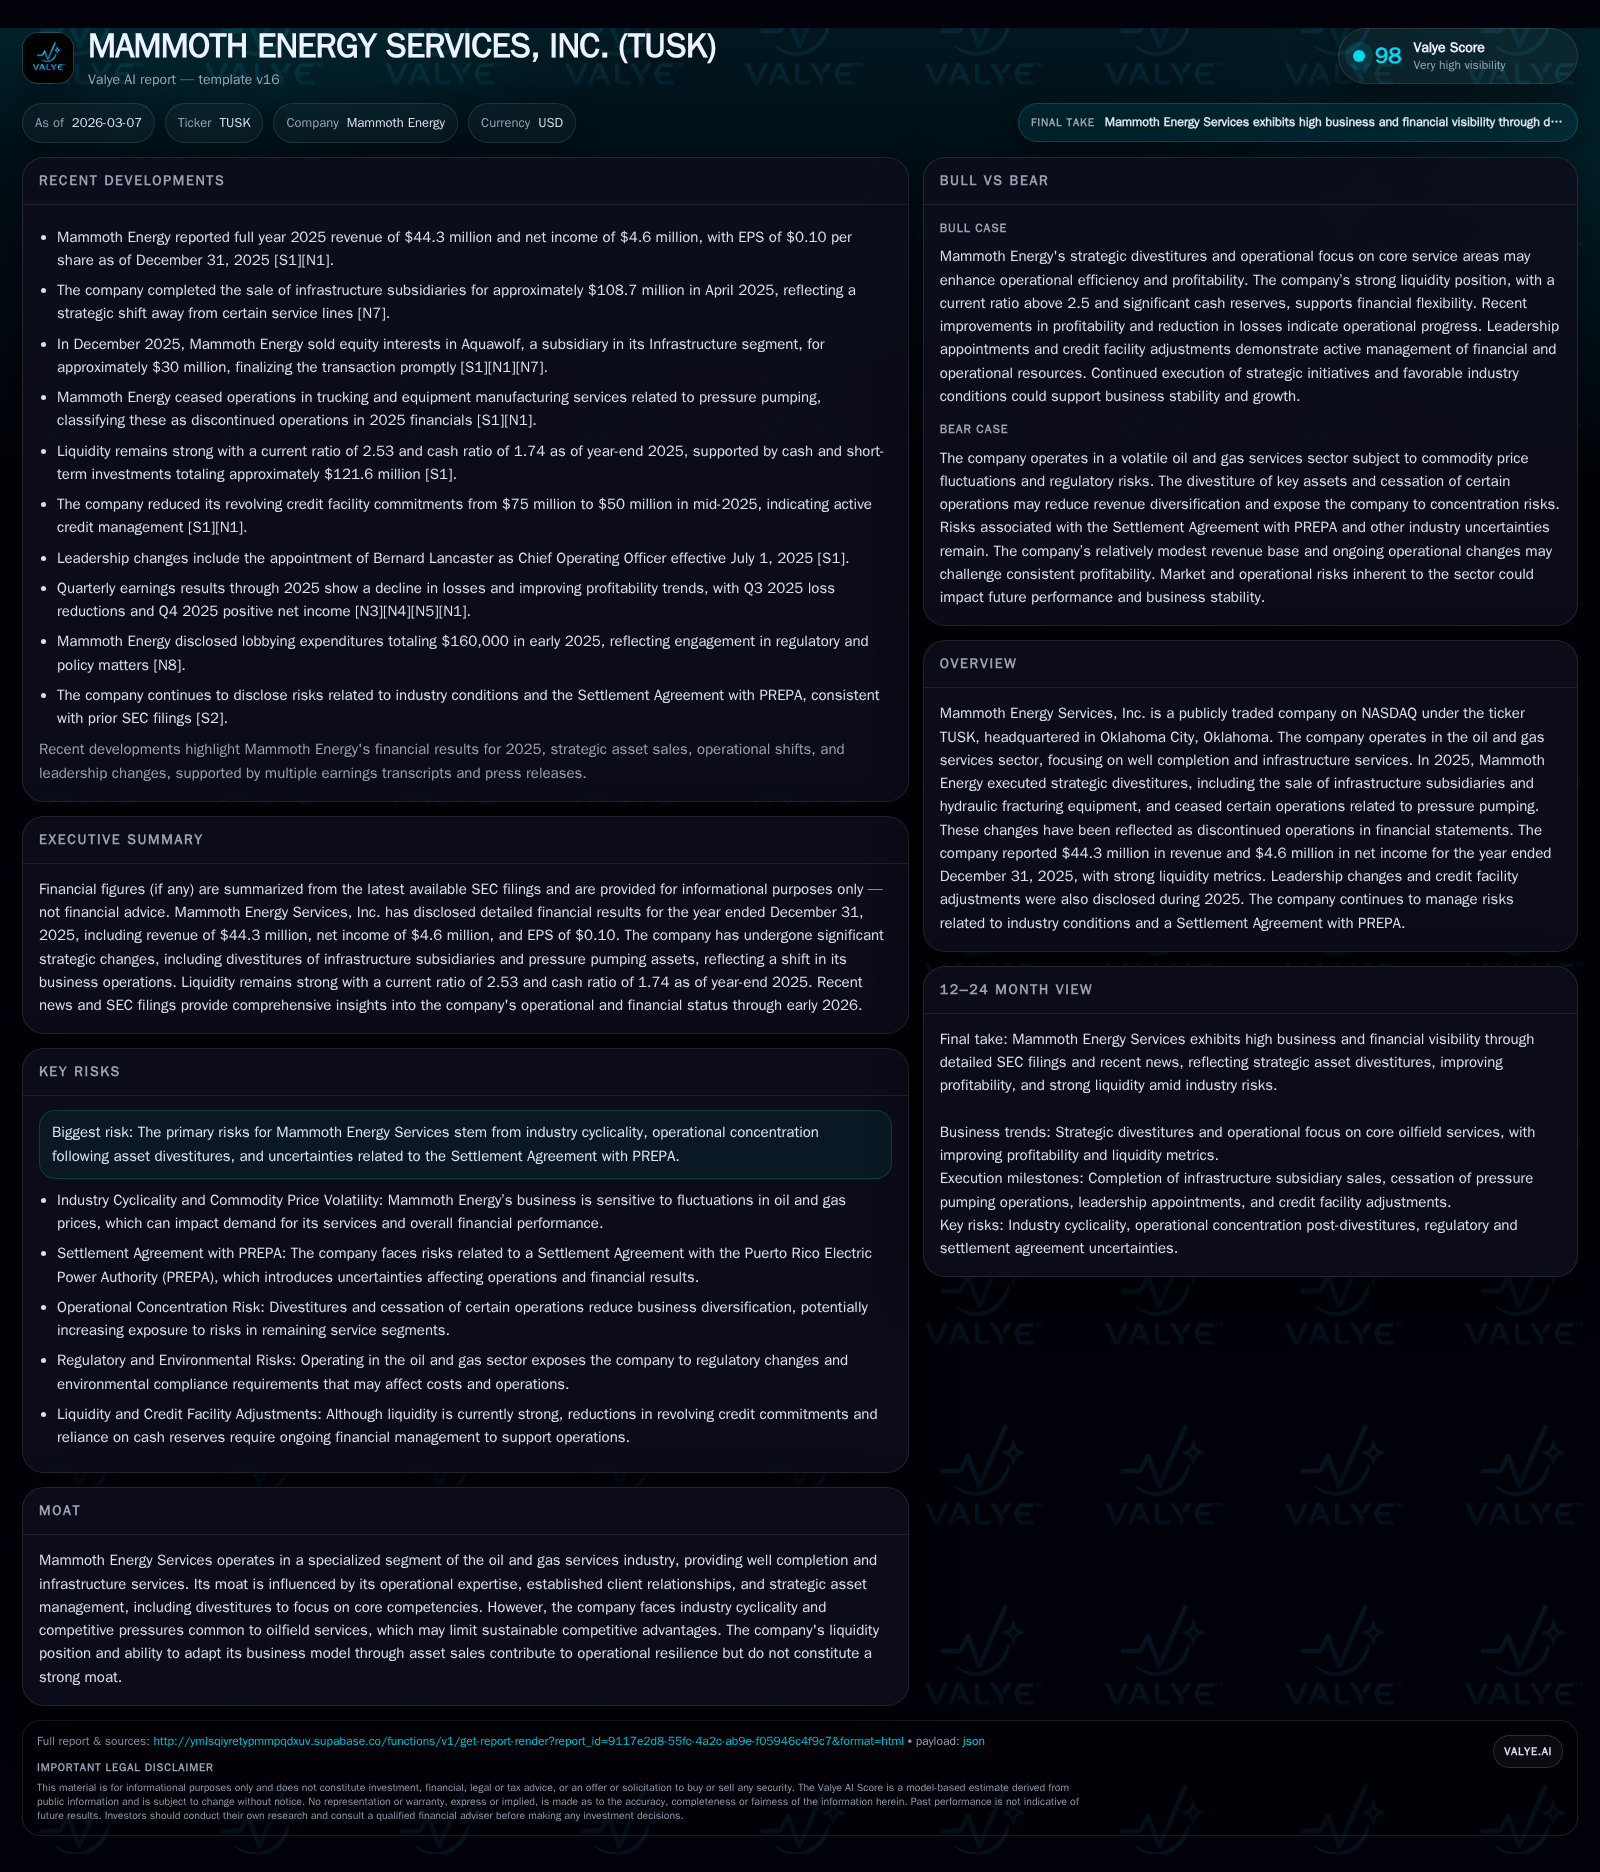
In 2025, Mammoth Energy pivoted through asset sales and operational shifts, resulting in sharply lower revenues but returning to net profitability.
Mammoth Energy Services, Inc. (TUSK) underwent a major business transformation in 2025, divesting infrastructure subsidiaries and selling hydraulic fracturing assets, leading to a significant revenue contraction of over 75%. Despite operating losses persisting, the company reported net income for the year, driven partly by discontinued operations. Liquidity remains strong with ample cash reserves, bolstered by credit facility adjustments and leadership changes aimed at improving execution and capital efficiency. Risks remain elevated due to industry cyclicality and concentrated customer exposure, alongside unresolved contingencies related to PREPA agreements.
Historical Performance
Mammoth Energy Services reported a sharp decline in annual revenue from $187.9 million in 2024 to just $44.3 million in 2025, reflecting a steep -76% year-over-year contraction [F1]. This drastic top-line shrinkage is attributable primarily to strategic divestitures executed throughout the year, notably the sale of infrastructure subsidiaries ("T&D Transaction") and hydraulic fracturing equipment along with ceasing pressure pumping operations [S1][S4][S13]. These substantial business elements were reclassified as discontinued operations per SEC filings [S1], which complicates direct operational comparability.
Operating income remained negative at -$57.4 million but improved relative to the prior year's loss of -$128.7 million, representing a roughly 55% reduction in operating losses [F1]. Despite continued operational challenges manifesting in negative operating cash flow (-$18.6 million), net income swung positive to $4.6 million for 2025 compared to a substantial net loss of -$207.3 million in 2024 [F1]. This return to profitability was supported by non-operational items linked to discontinued activities.
The balance sheet showed resilience with cash and equivalents totaling $102 million at year-end, surpassing current liabilities ($70 million) and resulting in a healthy current ratio of approximately 2.53x indicative of solid short-term liquidity [F1]. Equity declined sharply reflecting past impairments tied to asset disposals but stabilized at $258 million [F1]. Capital expenditure nearly quadrupled relative to the prior year, surging from $17 million in 2024 to $70.6 million in 2025; this capex spike likely corresponds with repositioning or reinvestment in areas aligned with Mammoth's refined strategic focus [F1].
Historical performance (annual)
| FY | Rev ($mm) | Net ($mm) | CFO ($mm) | OpInc ($mm) | Rev YoY | Net YoY |
|---|---|---|---|---|---|---|
| 2025 | 44 | 5 | -19 | -57 | -76.4% | +102.2% |
| 2024 | 188 | -207 | 181 | -129 | -39.3% | -6454.7% |
| 2023 | 309 | -3 | 31 | -17 | -14.5% | -411.0% |
| 2022 | 362 | -1 | 15 | -16 |
Source: SEC companyfacts cache [F1].
Capital returns and efficiency (annual)
| FY | FCF ($mm) | ROE% |
|---|---|---|
| 2025 | -89 | 1.8 |
| 2024 | 164 | -82.0 |
| 2023 | 12 | -0.7 |
| 2022 | -0.1 |
Source: SEC companyfacts cache [F1].
Table: Annual Financial Summary for Mammoth Energy Services, Inc., amounts in USD millions [F1]
Future Growth Prospects
The company's streamlined portfolio today emphasizes core well completion and infrastructure rental services after shedding pressure pumping assets and ceasing trucking and manufacturing operations related thereto [S1][S13]. Management has articulated an intent to improve execution via enhanced asset utilization and capital efficiency rather than expanding into new service lines aggressively [S1]. The aviation rental business also remains an area of interest due to its appeal as a capital-efficient leasing model providing flexibility without residual value risk for operators [S1].
Growth drivers may include incremental recovery or stability within oilfield activity levels supporting demand for equipment rentals and natural sand proppant services—the latter being more insulated due to vertical integration potential within fracturing supply chains [S1]. However, industry cyclicality remains acute; volatility in crude prices could heavily influence upstream capital spending decisions impacting Mammoth's customer orders [S1][S5].
Customer concentration also looms as a key constraint since five customers generated about 55% of total revenue at year-end 2025, elevating vulnerability should contract renewals or payment terms sour [S1]. The unsettled financial position regarding the multi-year Settlement Agreement with Puerto Rico Electric Power Authority (PREPA) adds uncertainty around timing and collectability that could negatively affect future liquidity [S1][S5].
Overall, growth is contingent on operational stabilization post-divestiture alongside favorable oilfield market conditions yet capped by external geopolitical factors including ongoing global energy market volatility.
Forecasts / Milestones / Expectations
Explicit public guidance appears limited following the transformative transactions during 2025; no updated revenue or margin targets have been announced per recent quarterly disclosures or earnings commentary [N1][S16][S17]. Close monitoring should focus on sequential quarterly performance metrics that reflect organic revenue trends absent discontinued units as well as updates regarding working capital recovery from PREPA settlements.
Capital structure developments such as credit facility amendments reducing revolver commitments from $75 million to $50 million also signal careful liquidity management intended to align borrowing capacity with leaner operational scale [S7][S8]. Leadership appointments like COO Bernard Lancaster taking office mid-2025 emphasize an internal focus on execution excellence rather than aggressive expansion [S8].
Future milestones worth watching include any disclosures on debt refinancing plans or covenant modifications linked to current leverage ratios, along with strategic announcements around asset acquisition or tested organic growth initiatives within rental or sand proppant segments.
Returns / Capital Allocation
Mammoth's focus has shifted away from shareholder distributions amid volatile operational results; the company has not declared dividends recently nor indicated share repurchase programs given cash flow constraints [F1][S1]. Free cash flow was negative by an estimated $89 million in fiscal year 2025 after removing capex spend from operating cash flow, underscoring liquidity challenges despite a healthy cash balance on hand [F1].
Return on equity stood near a modest positive level (~1.8%) driven by net income despite lower equity base post-asset sales [F1]. This suggests that although profitability returned after years of heavy losses, capital returns are still minimal relative to shareholder equity invested.
From July through December of 2025, the company engaged Fifth Third Bank for amendments reducing revolving credit limits consistent with downsized scale—preserving flexibility while potentially reducing associated fees or borrowing costs [S7][S8][S9][S13]. This structural adjustment aligns capital availability closely with revamped business operations.
Future capital allocation will likely prioritize deleveraging and reinvestment into core rental services alongside prudent working capital management until sustainable positive free cash flow can be re-established.
Industry Context Analysis
Oilfield services firms like Mammoth inherently contend with sequential cycles driven primarily by upstream exploration and production budgets reacting swiftly to commodity price signals worldwide. The shedding of hydraulic fracturing assets follows industry-wide consolidation trends where capital intensive segments like pressure pumping have seen overcapacity pressures that compress margins.
Meanwhile, rental equipment businesses tend toward steadier demand phases due to diverse application across drilling lifecycle stages, albeit not immune from macro swings tied to rig counts fluctuating across basins including Oklahoma’s SCOOP/STACK regions where Mammoth operates extensively [S1]. Persistent geopolitical tensions encompassing Eastern Europe and Middle East exacerbate price volatility risks making forecast accuracy difficult.
Risks Summary
Key risks documented include:
- Concentration risk: Top five customers contribute over half of revenues raising payment default potential exposure amidst economic stress.
- Industry cyclicality: Demand directly linked to upstream capex; downturns depress service volumes rapidly.
- Contractual uncertainties relating to PREPA Settlement Agreement can impact cash collections materially.
- Operational risks tied to integration post-divestitures including workforce retention and maintaining service quality.
- Geopolitical instability downstream affects oil pricing dynamics crucial for capital investments fueling demand.
These risk factors warrant cautious monitoring given their potential materiality on Mammoth’s financial health moving forward [S1][S5][S6].
Conclusion
The year ended December 31, 2025 marked a watershed period for Mammoth Energy Services as it exited sizeable asset bases triggering deep declines in revenue but improved overall earnings results including a slim net profit aided by discontinuations treatment on accounts.
While liquidity parameters improved coupled with focused operational leadership changes aimed at enhancing margins via measured asset management executed through multiple divestiture deals, looming cyclicality challenges alongside counterparty concentrations limit upside visibility near term.
Investors and industry watchers should track forthcoming quarterly data releases closely for organic top-line stabilization signs plus updates on contentious settlements such as PREPA obligations which have outsized implications relative to Mammoth’s refined footprint today.
Disclaimer: This analysis is based solely on publicly available information as of March 7, 2026, including SEC filings and earnings releases cited herein, without offering investment advice or price targets.
Disclaimer: This is research-only, informational analysis and not investment advice. It may include AI-generated interpretation and general industry context. Always verify important details using primary sources.
Comments