
HEICO Corporation’s Acquisition-Driven Growth Outpaces Aerospace Market Trends
HEICO integrates organic growth with strategic acquisitions to expand its aerospace aftermarket and electronic technologies footprint.
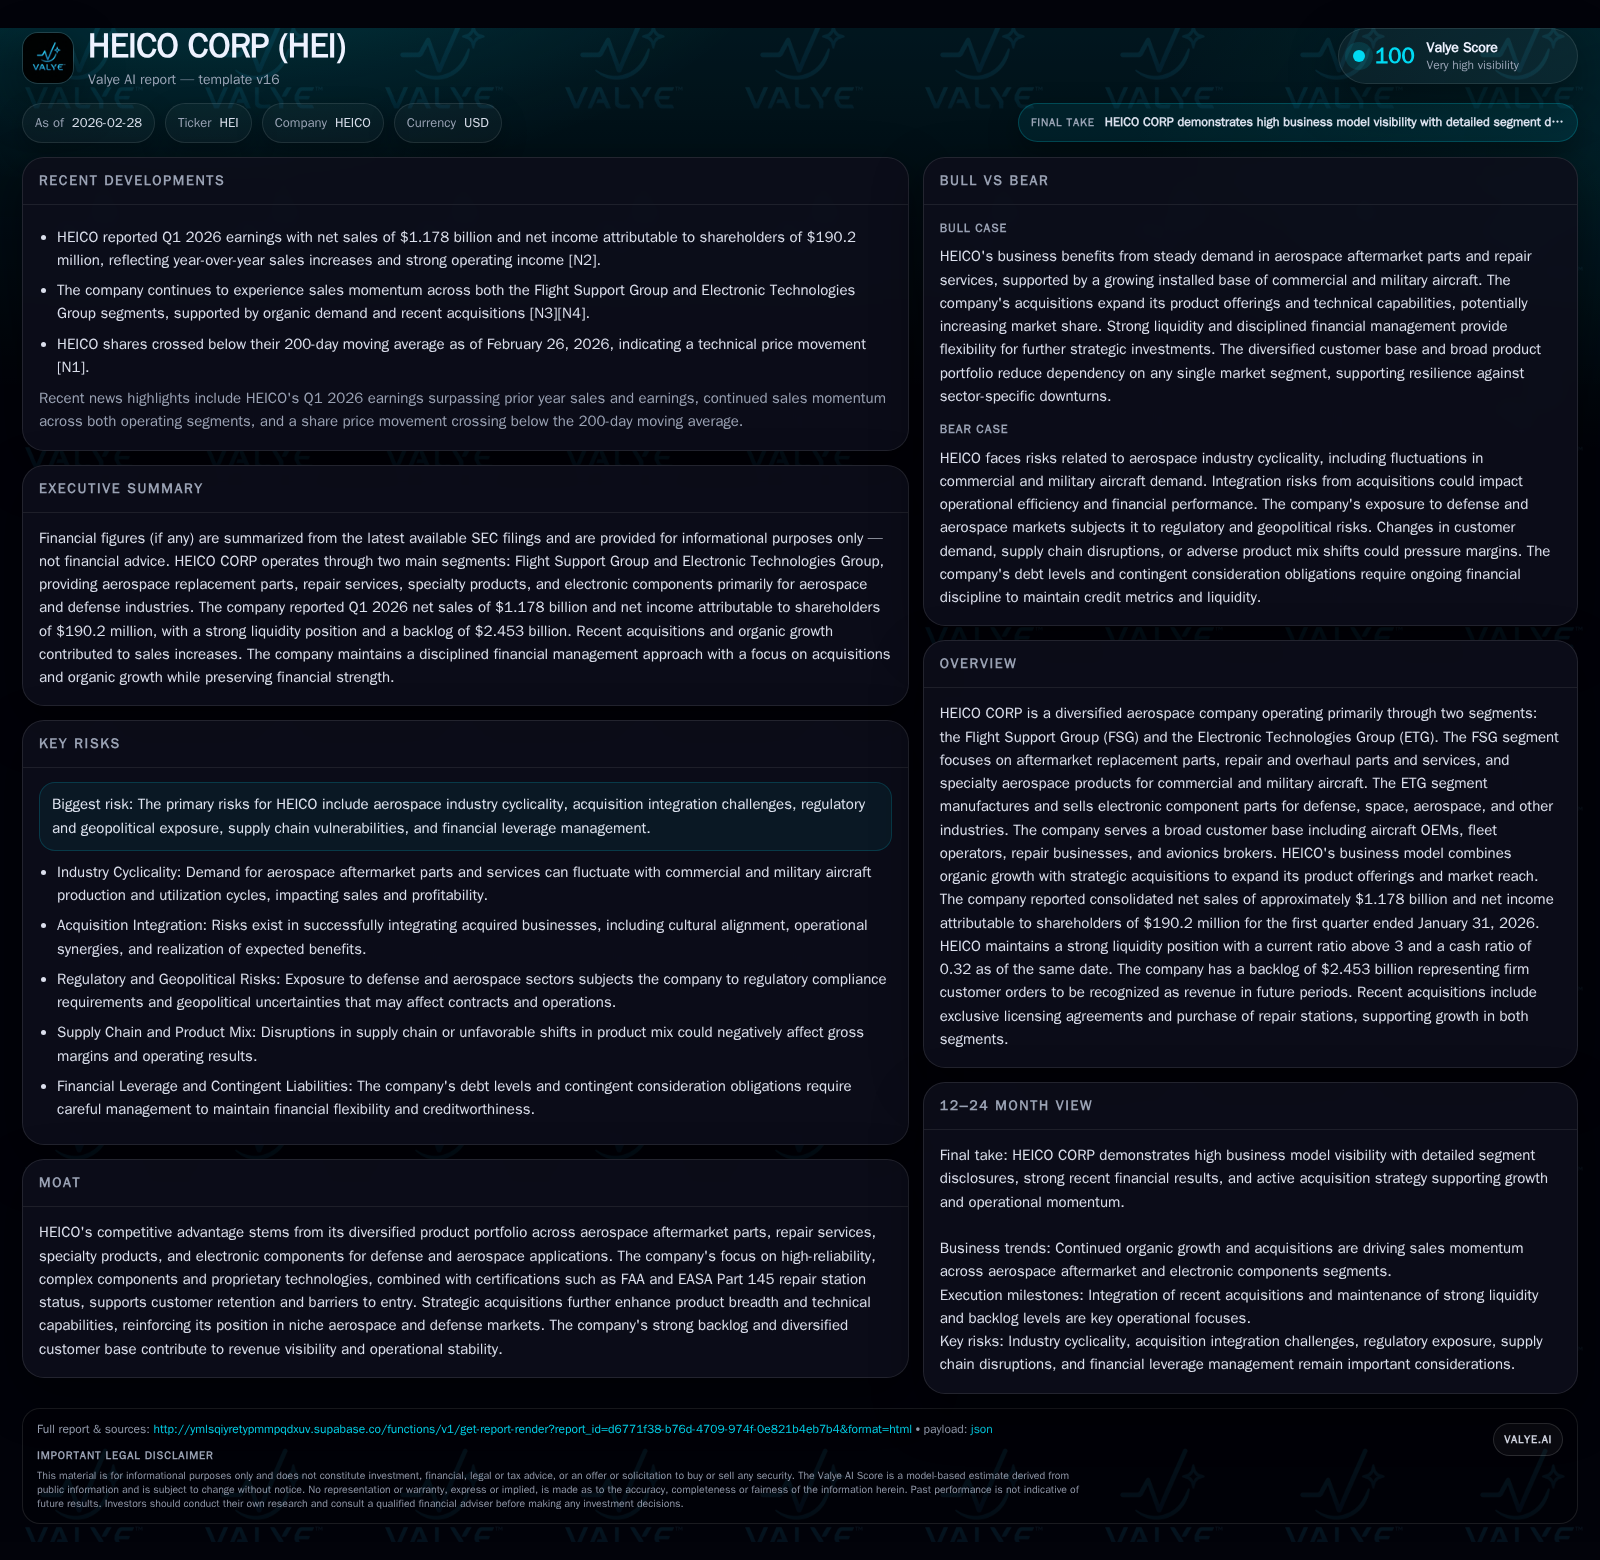
HEICO Corporation demonstrated robust financial momentum in FY2025, reporting significant revenue and profitability gains supported by both organic demand and a $441 million acquisition in Q1 FY26. The firm's two-segment model—Flight Support Group (FSG) and Electronic Technologies Group (ETG)—enabled balanced growth across diverse aerospace and defense niches. Capital allocation remains disciplined, with ample free cash flow supporting dividends and acquisitions while maintaining leverage within covenant thresholds. Investors should monitor backlog strength, integration of recent bolt-ons, and geopolitical factors influencing supply chains in 2026.
Evolution of HEICO’s Revenue and Profitability: Analyzing Recent Trajectory
HEICO Corporation achieved substantial financial growth over the past several years, culminating in fiscal 2025 revenue of approximately $4.49 billion, representing a 16.3% increase compared to FY2024's $3.86 billion [F1]. Operating income outpaced top-line growth with a 23.6% jump to nearly $1.02 billion, indicating improved operational efficiency amidst expansion efforts. Net income surged even more sharply—34.3% higher year-over-year—to roughly $690 million.
Operating cash flow expanded impressively by nearly 39%, rising to approximately $934 million for FY2025, reflecting strong core business cash generation despite sizable spending on acquisitions and working capital investments. Capital expenditures increased to about $73 million, up 25% from FY2024 levels as the firm invested in capacity enhancements and technology-driven manufacturing upgrades.
This upward performance trend underscores HEICO’s success in balancing organic aftermarket demand growth with accretive acquisition activity that has significantly boosted scale without sacrificing profitability margins.
Historical performance (annual)
| FY | Rev ($bn) | Net ($mm) | CFO ($mm) | OpInc ($mm) | Rev YoY | Net YoY |
|---|---|---|---|---|---|---|
| 2025 | 4.5 | 690 | 934 | 1019 | +16.3% | +34.3% |
| 2024 | 3.9 | 514 | 672 | 824 | +30.0% | +27.4% |
| 2023 | 3.0 | 404 | 449 | 625 | +34.4% | +14.8% |
| 2022 | 2.2 | 352 | 468 | 497 |
Source: SEC companyfacts cache [F1].
Capital returns and efficiency (annual)
| FY | Div ($mm) | FCF ($mm) | ROE% |
|---|---|---|---|
| 2025 | 32 | 861 | 16.0 |
| 2024 | 29 | 614 | 14.1 |
| 2023 | 27 | 399 | 12.8 |
| 2022 | 24 | 436 | 13.5 |
Source: SEC companyfacts cache [F1].
Flight Support Group and Electronic Technologies: Growth Drivers and Segment Dynamics
HEICO’s business operates primarily through the Flight Support Group (FSG) and Electronic Technologies Group (ETG), each serving distinct markets within aerospace and defense sectors [S10]. FSG focuses on aftermarket replacement parts, repair and overhaul services for commercial and military aircraft jet engines, avionics, composites including flight surfaces, alongside specialty products such as thermal insulation systems and emergency equipment.
During Q1 FY26, FSG exhibited robust organic sales growth driven by increased demand for both replacement parts (+$59.5 million) and repair/overhaul services (+$20.6 million), signaling strengthening aftermarket trends [S7]. This segment’s gross profit margin improved marginally (+0.4%) due to favorable product mix within the repair/overhaul line.
Conversely, ETG advanced net sales influenced partly by acquisitions ($21.5 million contribution) alongside organic gains principally from aerospace electronics (+$8.1 million) but faced margin compression (-3.2%) attributable to a less favorable defense product mix and softness in certain space product sales (-$3.4 million) [S7]. Products here encompass electro-optical devices, radio frequency (RF) components, power amplifiers, and onboard avionics subsystems — critical to high-reliability applications.
While FSG capitalizes on broad-based commercial fleet servicing opportunities, ETG balances defense innovation cycles with some exposure to cyclicality in space sector demand.
Strategic Acquisitions Fortify Product Breadth and Market Position
Acquisitions remain integral to HEICO’s strategy to deepen capabilities within niche aerospace aftermarket segments while augmenting electronic components portfolio utilized across defense platforms [N1][S9]. The most notable recent transaction closed in Q1 FY26 involved a $441 million bolt-on enhancing both FSG’s specialized product offerings and ETG’s technology base.
These bolt-ons reinforce proprietary technologies underpinning FAA/EASA Part 145 certified repair facilities—a significant barrier protecting customer loyalty—and contribute immediately to backlog expansions improving revenue visibility.
Integration execution tightness is vital given HEICO's strategy of complementing organic sales drives with targeted acquisitions rather than large-scale mergers—managing contract assets/liabilities effectively ensures minimal disruption from deferred revenue accounting impacts noted post-acquisition [S9].
Financial Health and Capital Allocation: Managing Debt, Dividends, and Buybacks
HEICO maintains a conservative capital structure supporting its acquisition-driven expansion without compromising liquidity or covenant compliance [S4][S8]. As of January 31, 2026, total debt stands near $2.5 billion comprising $1.2 billion in senior unsecured notes due in August of 2028/2033 carrying coupon rates slightly above mid-5%, complemented by borrowings under a revolving credit facility maturing in fiscal year 2028 [F1][S8][S16].
Leverage metrics remain moderate relative to equity levels of approximately $4.3 billion as of October FY25-end leading to an estimated ROE around 16%, consistent with healthy returns in aerospace specialty suppliers [F1].
With free cash flow approximating $861 million (operating cash flow minus capex), HEICO sustains dividend payments near $32 million annually while retaining flexibility for further acquisitions or share repurchases if market conditions favor [F1][S25][S28]. Quarterly dividend increases have been modest but reflect steady commitment to shareholder distributions balanced against reinvestment priorities.
Operating Leverage Trends and R&D Investments Enhancing Competitive Edge
Operating leverage remains supported by increasing scale combined with measured SG&A spending rises tied largely to acquisition support functions [$195M Q1 SG&A vs $179M prior year quarter—+$7.5M attributable to acquisitive activity] [S7]. Despite these costs, gross margins held at a strong near-39% level aided by product mix optimization particularly within FSG repair services.
Research & Development expenses reported within cost of sales rose year-on-year from $27.6 million to nearly $31.9 million reflective of continuing investment aimed at sustaining certification credentials such as FAA/EASA Part 145 repair station approval critical for regulatory compliance in aerospace repair markets [S7][S13]. These R&D efforts underpin engineering improvements for complex composite assemblies, avionics modules powering critical flight safety systems, thereby reinforcing HEICO’s moat based on technical differentiation.
Backlog Visibility, Customer Base Diversification, and Geopolitical Risk Factors
HEICO benefits from an extensive backlog driven by diversified global customers comprising major airframe OEMs, airline fleets worldwide using aftermarket replacement parts extensively for maintenance cycles, defense agencies commissioning precision electronic components as well as avionics brokers facilitating component brokerage markets [S5][N1]. This breadth mitigates volatility typical in aerospace cycles where OEM production can fluctuate sharply due to macroeconomic shocks.
However, external risks persist including global geopolitical tensions impacting supply chain logistics especially within semiconductor content for ETG products or raw material sourcing constraints affecting composite specialty parts within FSG segments [S5]. Currency fluctuations also pose exposure given international operations but are partially offset through geographic sales diversification strategies.
Outlook for 2026 and Beyond: Growth Catalysts and Potential Constraints
Management commentary accompanying the Q1 FY26 results confirms expectations for sustained sales acceleration supported organically across both FSG’s aftermarket expansion initiatives complemented by integration synergies from recent acquisitions totaling over $441 million announced this year [N1][N4][S13]. The firm continues pursuing further bolt-on acquisitions aligned with technological fit rather than volume-led consolidation permitting flexible capital deployment below rigid timelines.
Margins may face near-term pressure primarily within ETG due to evolving defense procurement patterns but the stronger FSG segment mix supports overall earnings growth trajectory [N1]. Capital expenditures forecast range between $80-$90 million for the full fiscal year reflects ongoing capacity investments aligned with market demand signals.[S13]
Key monitoring points comprise successful assimilation of acquisitions without diluting operational focus; maintaining FAA/EASA certifications amid regulatory intensification; managing supply chain disruptions amid geopolitical uncertainties; sustaining organic customer demand tied closely to commercial aviation recovery pace alongside defense budget allocations that influence ETG orders.
Investors should also watch deferred revenue fluctuations embedded in contract liabilities which may signal cadence shifts in customer billing cycles post-acquisition impacting short-term revenue recognition profiles.[S8]
Disclaimer: This analysis reflects information available as of late February 2026 based solely on documented company financial disclosures ([F1],[S#]), official earnings releases ([N#]), and observed market data without speculative assumptions or forward-looking price guidance.
Disclaimer: This is research-only, informational analysis and not investment advice. It may include AI-generated interpretation and general industry context. Always verify important details using primary sources.
Comments