
Heritage Insurance Holdings Surges with Operational Excellence and Capital Strategy
The company delivered strong earnings and cash flow growth in fiscal 2025 driven by underwriting discipline and reinforced capital structure.
Heritage Insurance Holdings posted a sharp rise in operating income and net income in 2025, supported by modest revenue growth but significant margin expansion. Operational leverage combined with rigorous expense and claims management fueled profitability gains. The balance sheet strengthened materially, bolstering liquidity to support underwriting flexibility amid regulatory headwinds. Capital allocation shifted toward reinvestment, suspending dividends and share buybacks as cash flow generation surged.
Revenue and Profitability Trajectory: Strong Upward Shift in 2025
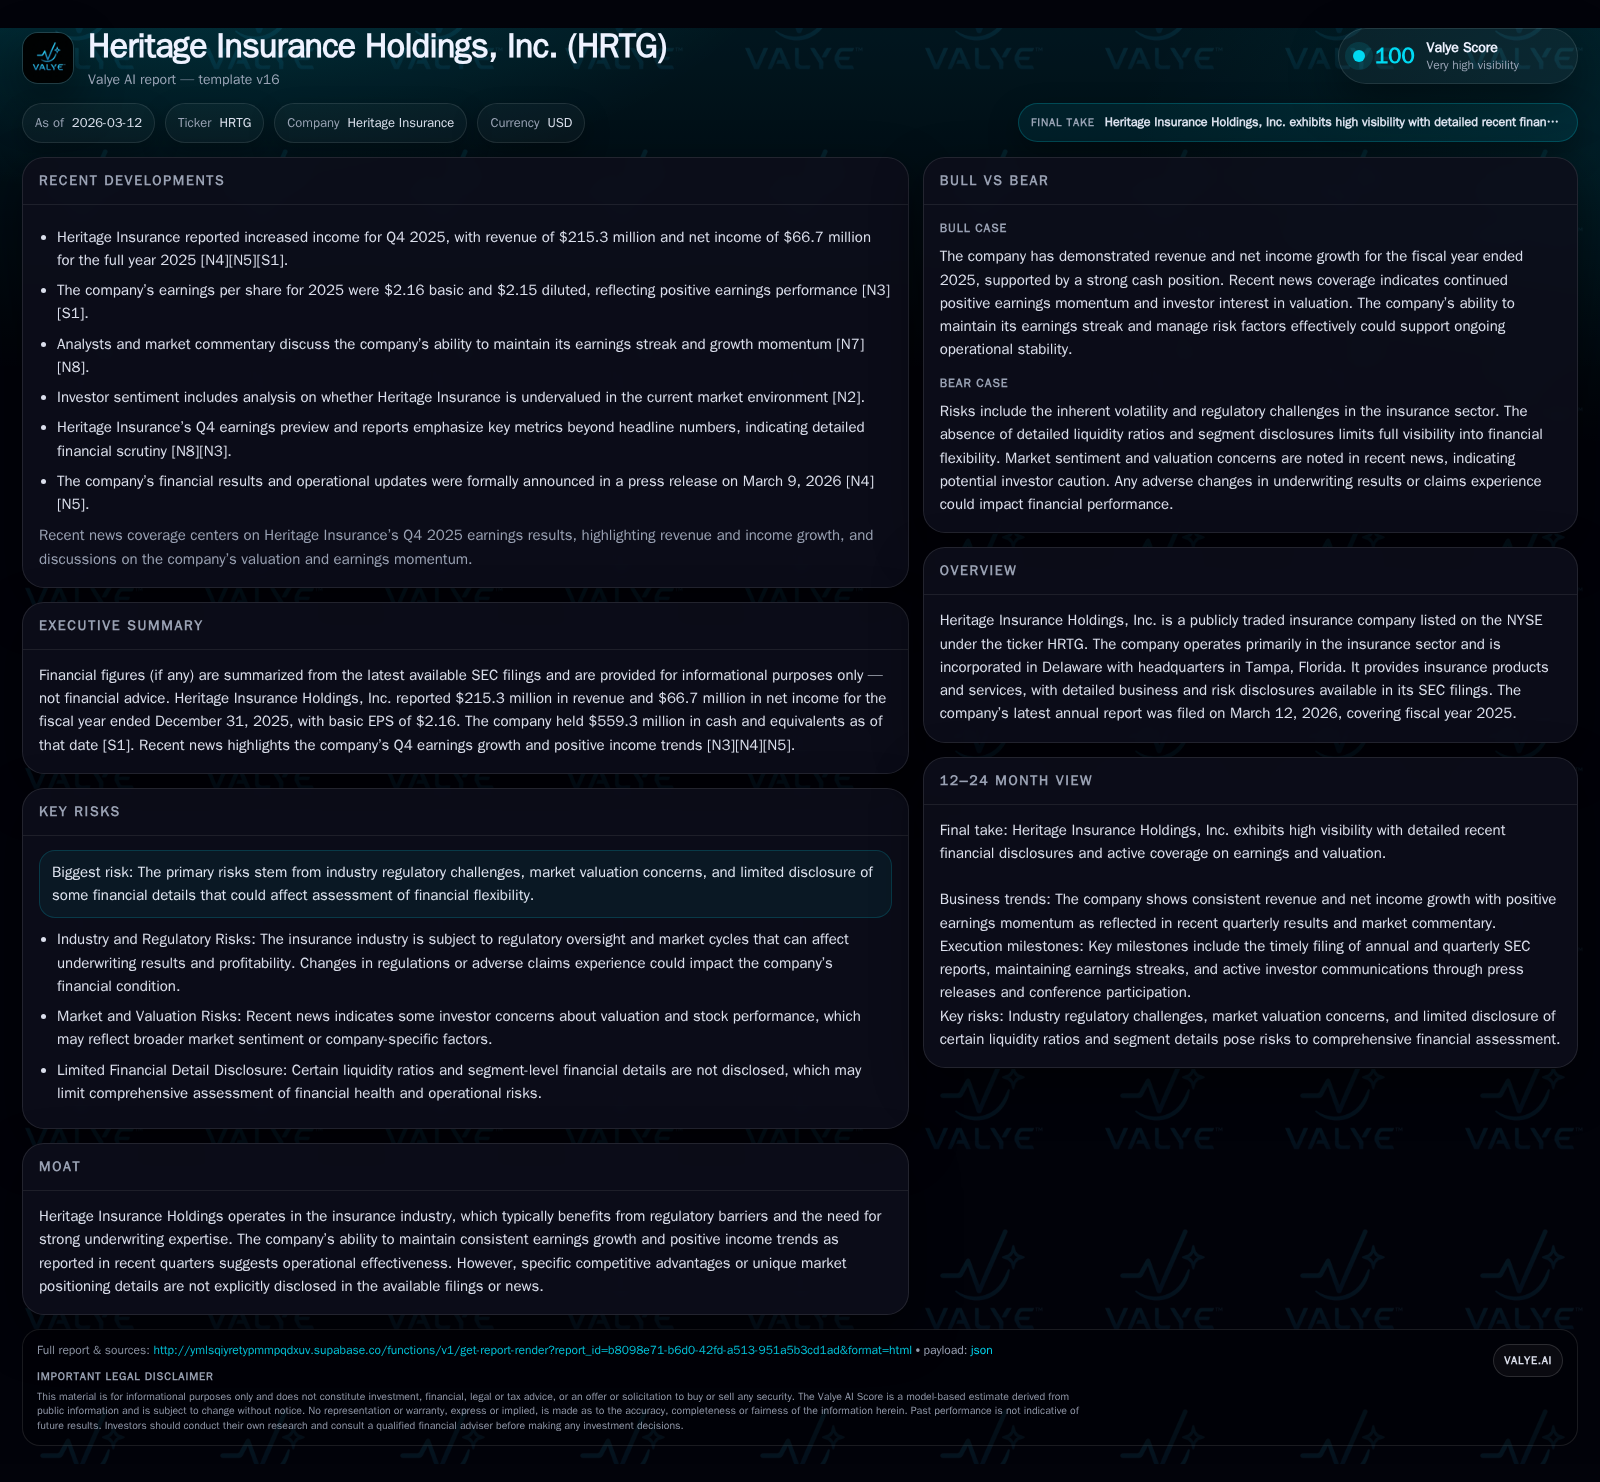
Heritage Insurance Holdings demonstrated notable financial progress in fiscal year 2025, delivering a measured top-line increase paired with explosive gains in profit metrics. Total revenues advanced by approximately 2.4% year-over-year to reach $215.3 million [F1], reflecting ongoing earned premium growth as described in recent earnings commentary [N3]. However, it is the disproportionate expansion in operating income and net income that marks the salient feature of the year’s results.
Operating income climbed by an exceptional 184.5%, soaring from $31.5 million in FY2024 to $89.7 million in FY2025 [F1]. This jump translated into a significant operating margin improvement exceeding 40%, suggesting robust underwriting performance beyond mere volume increments [N2]. Net income reflected an even sharper escalation of roughly 228.6%, rising from $20.3 million to $66.7 million over the same period [F1], underscoring operational leverage benefits coupled with tighter expense control.
While Heritage does not explicitly disclose combined ratio figures inside filings, insurer-focused analysts spotlight improvements likely underpinning these results through enhanced loss ratios and prudent claims reserving practices [N6]. The operating environment thus fostered a rare confluence of top-line stability with margin-rich profit attainment.
Key Drivers Behind Profit Explosion: Operational Leverage and Expense Management
Management’s disclosures emphasize core underwriting discipline as central to Heritage’s financial transformation [S3]. The company benefited from careful risk selection amid fluctuating catastrophe exposures, preserving earned premium quality rather than aggressively chasing volume at unsustainable terms [N9]. Earnings growth was powered significantly by a marked improvement in underwriting profit — characterized by favorable claims frequency trends and effective claims cost containment.
Expense ratios also contracted owing to tighter operational controls across sales commissions, administrative costs, and technology efficiencies appropriate for a regional insurance specialist [S3]. These improvements align with industry standards where combined ratios below 100% indicate nominal underwriting profitability.
Furthermore, Heritage's conservative reserving approach yielded reserve releases contributing positively to current year earnings without jeopardizing loss reserve adequacy — an important nuance highlighted during quarterly management calls [N13]. This precision exemplifies an insurer adept at navigating volatile loss environments while maintaining prudent capital integrity.
Balance Sheet Evolution and Liquidity Position: Capital Strength Reinforced
The company's balance sheet experienced a transformative uplift throughout 2025, driven both by retained earnings accumulation and controlled capital deployment strategies. Shareholders’ equity nearly doubled from approximately $290.8 million at the end of FY2024 to $505.3 million at FY2025 year-end [F1]. This substantial growth enhances the company’s statutory surplus cushion crucial for underwriting capacity under regulatory oversight.
Cash and cash equivalents ballooned impressively to $559.3 million as of December 31, 2025 [F1], positioning Heritage among insurers with superior liquidity mandates needed for weathering catastrophe events or potential claims spikes [S9][S10][S16]. Debt levels remained manageable according to recent SEC disclosures, preserving conservative leverage suitable for regulatory compliance.
Such fortified capital structure directly supports Heritage's ability to write new policies selectively and absorb unpredictable claim volatility without recourse to dilutive equity issuance or aggressive debt refinancing—a topic regularly assessed by rating agencies evaluating insurer creditworthiness.
Regulatory Environment and Risk Framework: Impact on Company Forward Path
Industry-wide regulatory challenges remain front-and-center risks influencing Heritage’s strategic options [S4][S6]. These include evolving state-level insurance regulations impacting pricing freedoms, reserve requirements, and heightened scrutiny over catastrophe risk models [N11]. Moreover, litigation risks tied to claim disputes persist given complex policy language interpretations common in residential property insurance writing regions where Heritage operates.
Still, the firm’s demonstrated ability to maintain disciplined underwriting standards serves as a mitigating factor toward these headwinds. Its historical reserve methodologies have avoided abrupt adverse development patterns while steady compliance with regulatory frameworks positions it prudently amid shifting external pressures.
Nonetheless, potential increases in loss cost inflation or mandated rate rollbacks could challenge future earnings resilience—a factor investors will need close monitoring given broader market volatility affecting Property & Casualty insurers.
Capital Allocation Approach: Dividend Pause, Buyback Halt, and Reinvestment Focus
Reflecting a strategic pivot aligned with burgeoning cash flow strength, Heritage has suspended dividend payouts since prior years (notably near-zero dividends recorded recently) and paused all stock repurchase programs as per latest reporting cycles [F1][S19]. This shift signals prioritization of internal reinvestment over immediate shareholder returns—a common stance among insurers focused on bolt-on underwriting growth or infrastructure enhancement.
Operating cash flow rose dramatically by approximately 109% year-over-year to $182.2 million in FY2025 [F1], creating ample free cash flow after deducting modest capital expenditures (~$8.07 million) typical for business continuity spending rather than expansion capex [F1]. This ample FCF cushion promotes funding new policy acquisition initiatives or strengthening reserves without diluting shareholder equity.
Such capital retention underscores management’s preference for conservatism typical in insurance sectors where reserve adequacy often supersedes aggressive distributions; this conservative posture reflects prudent capital stewardship consistent with sector norms.
What to Monitor Going Forward: Growth Catalysts and Potential Headwinds
While explicit revenue or earnings guidance for subsequent periods is absent from SEC filings or press releases, several key variables merit close observation moving forward [N12][N14]:
- Underwriting discipline consistency especially around catastrophe-exposed geographies; any loosening could pressure combined ratios adversely.
- Pricing environment evolution amid inflationary pressures influencing earned premiums and claim costs simultaneously.
- Investment portfolio returns which significantly impact insurance net income beyond core underwriting margins given yield curve dynamics.
- Reserve development trends monitored through quarterly disclosures will provide early signals on loss reserve adequacy or emerging liabilities.
- Regulatory updates including possible changes in rate approvals or new legislative mandates affecting product offerings or capital requirements.
These factors collectively will dictate whether Heritage sustains its remarkable profit recovery trajectory or encounters volatility reminiscent of prior industry cycles.
Summary Table: Financial & Cash Flow Trends from FY2022 to FY2025
Historical performance (annual)
| FY | Rev ($mm) | Net ($mm) | CFO ($mm) | OpInc ($mm) | Rev YoY | Net YoY |
|---|---|---|---|---|---|---|
| 2025 | 215 | 67 | 182 | 90 | +2.4% | +228.6% |
| 2024 | 210 | 20 | 87 | 32 | +12.5% | -34.4% |
| 2023 | 187 | 31 | 70 | 36 | +7.1% | +147.5% |
| 2022 | 175 | 13 | -34 | 15 |
Source: SEC companyfacts cache [F1].
Capital returns and efficiency (annual)
| FY | Div ($mm) | Buybacks ($mm) | FCF ($mm) |
|---|---|---|---|
| 2025 | 174 | ||
| 2024 | 0 | 79 | |
| 2023 | 0 | 0 | 61 |
| 2022 | 5 | 7 | -36 |
Source: SEC companyfacts cache [F1].
Note: All figures are rounded; percentages represent year-over-year changes; CFO denotes operating cash flow; Capex excludes acquisitions.
This analysis relies solely on audited financial statement data supplemented with management disclosures and market commentary up through March 2026 filings/reports without speculative forecasting or valuation judgments.
Disclaimer: This is research-only, informational analysis and not investment advice. It may include AI-generated interpretation and general industry context. Always verify important details using primary sources.
Comments