
Intercontinental Exchange’s Financial Fortitude Amid Market Volatility and Geopolitical Uncertainties
A deep-dive on ICE’s diversified revenue streams, operational resilience, and positioning within a dynamic global exchange ecosystem.
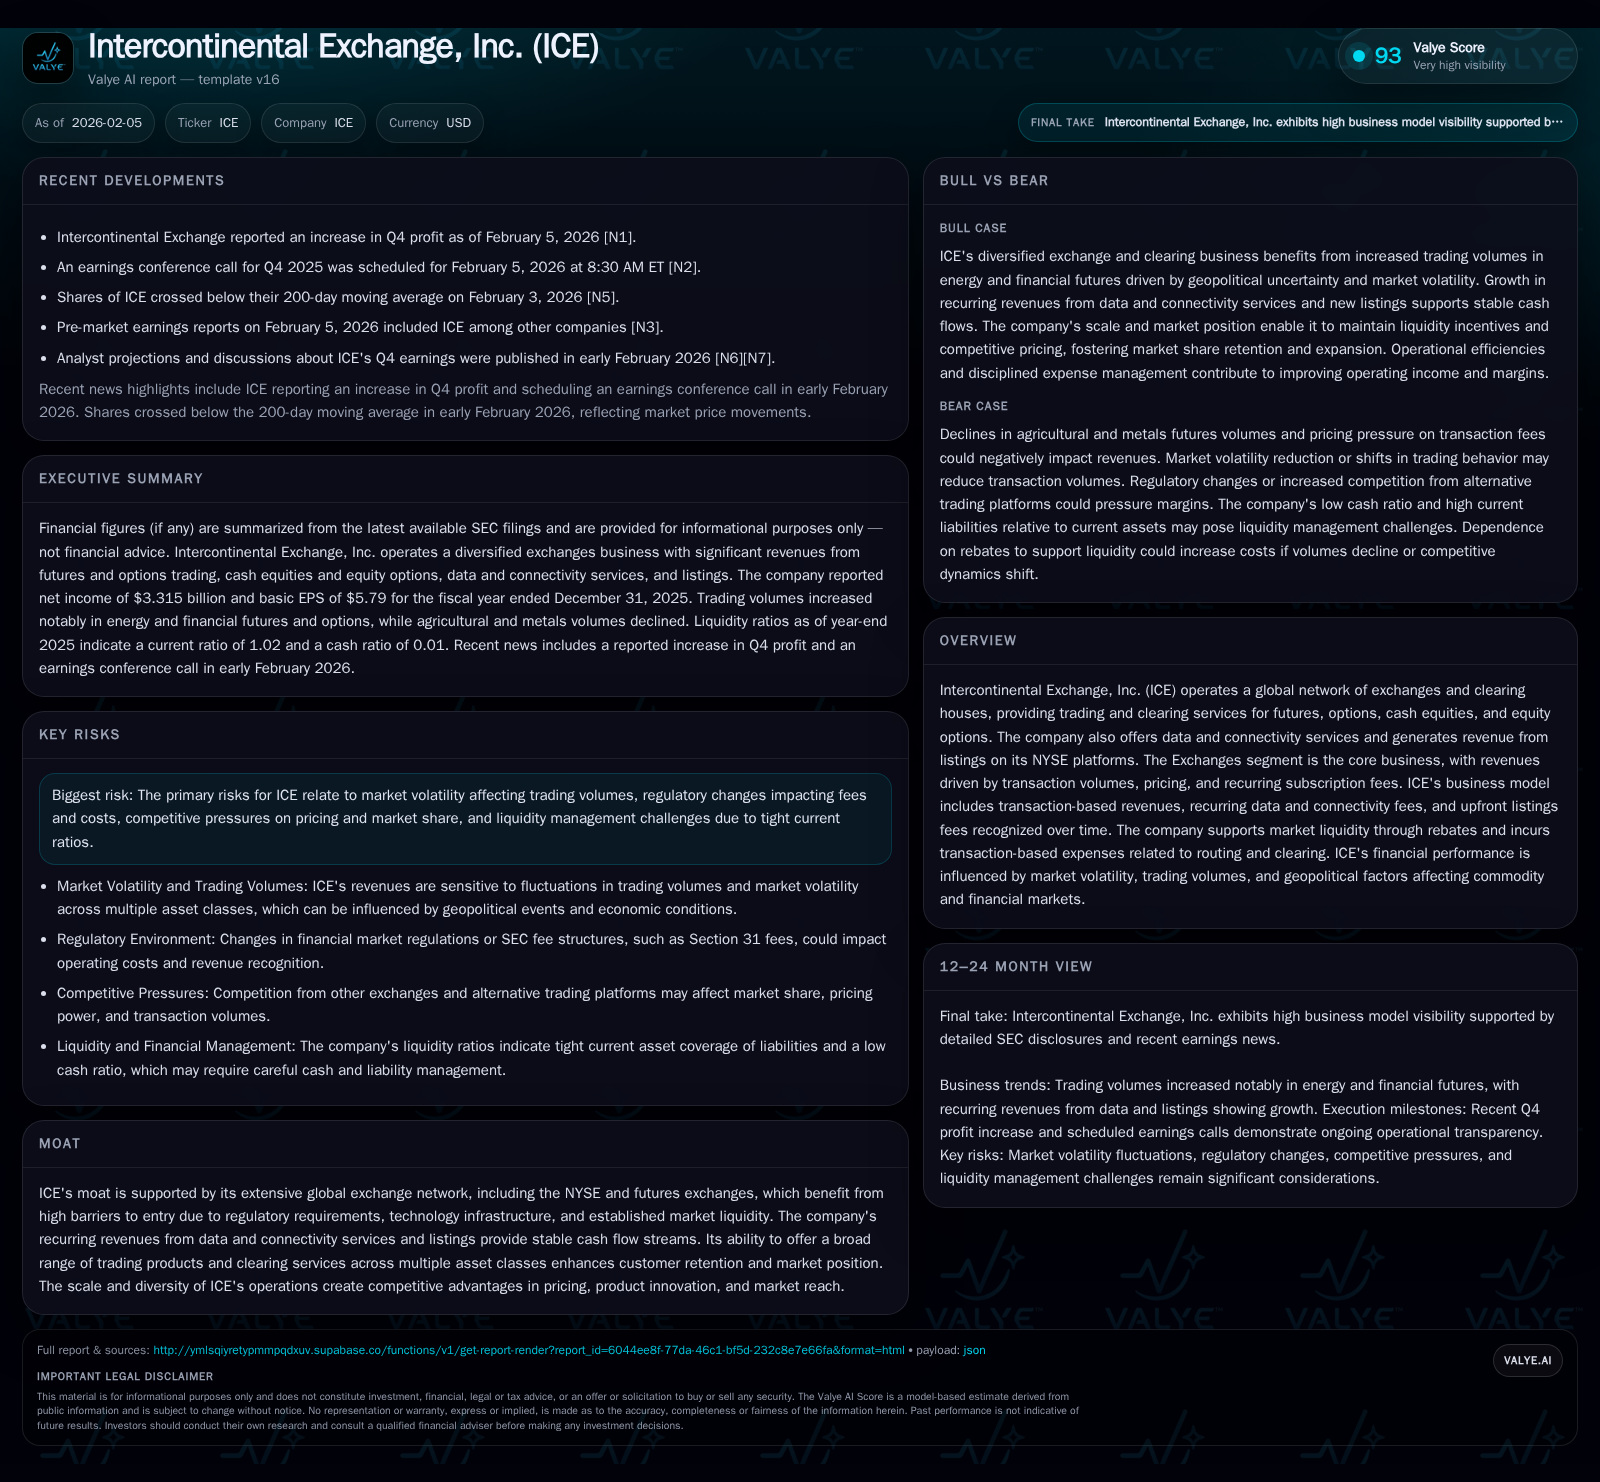
Intercontinental Exchange, Inc. (ICE) navigates a volatile macroeconomic and geopolitical landscape through its diversified business model spanning Exchanges, Fixed Income & Data Services, and Mortgage Technology. The company’s Q4 2025 earnings beat underpinned by robust transaction volumes and recurring revenue growth highlights its core strengths. While rising interest rates and evolving regulation present risks, ICE’s moats in technology infrastructure, market liquidity, and multi-asset offerings fortify its competitive edge. Relative to peers, ICE demonstrates balanced segment contributions and adaptability to shifting market dynamics.
Charting ICE’s Multi-Segment Revenue Streams Amid Market Flux
Intercontinental Exchange operates through three primary segments — Exchanges; Fixed Income & Data Services; and Mortgage Technology — each with distinctive sensitivities to underlying market conditions [S1][F1]. ICE’s Exchanges segment commands the lion's share of revenues (~$8.12 billion in 2025), capturing transaction-based fees from futures/options trading across energy (+16% YoY growth), financials (+9%), agricultural products (-10%), as well as cash equities (+9%) [S1]. These transactional revenues are complemented by recurring data licensing and connectivity fees that contributed $1.03 billion in 2025 within the same segment.
Fixed Income & Data Services offer a counterbalance to the episodic nature of transaction volumes. This segment delivers fixed income pricing, analytics, indices, reference data alongside CDS clearing services. These recurring fees lend stability to ICE's top line amidst episodic market spikes or contractions [S1]. Finally, Mortgage Technology faces headwinds as mortgage origination slows due to rising interest rates but has shifted towards modest positive operating income after prior years' losses signaling early signs of stabilization [S1].
The interplay between transaction-based revenues — which directly correlate with market volatility — and subscription-style income underpins ICE’s resilience in a fluctuating macroeconomic environment.
Dissecting the Q4 2025 Earnings Beat: Drivers and Nuances
ICE delivered a notable earnings beat for Q4 2025 with net income climbing to $3.3 billion for the full year representing double-digit growth over prior years [N9][S1]. This outperformance was driven by increased trading activity across major asset classes amid persistent global volatility encompassing inflationary pressures and geopolitical uncertainties [N4][N5]. Margins expanded four percentage points operating at a robust 50%, reflecting disciplined cost management alongside revenue growth [S1].
Market expectations were cautiously optimistic leading into earnings season backed by forward guidance highlighting positive momentum primarily within the exchanges business [N8]. Despite shares dipping below the critical 200-day moving average post-release due to broader market rotations, analysts underscored strong fundamental execution underpinning ICE’s financials [N10]. The ability to maintain margin expansion signals operational leverage within core business lines amidst tighter cost controls.
Exchanges Segment: The Core Engine Powering Transaction Volumes
The exchanges unit remains ICE’s financial backbone accounting for over $8 billion in revenues in 2025 [S1]. Within it, futures contracts tied to energy commodities surged 16%, supported by elevated price volatility globally due to supply chain disruptions and geopolitical events. Cash equities trading volumes rose 9%, evidencing steady liquidity in listed securities on NYSE platforms benefiting listings revenue despite minor year-over-year variance.
Transaction-pricing dynamics hinge on both volume fluctuations and rate-per-contract adjustments, dictated partially by market competition but balanced through strategic rebate programs aimed at sustaining liquidity. Transaction-based expenses scaled correspondingly (+9%) reflecting costs associated with order routing and clearing processes inherent in high-frequency equity markets [S1]. Notably, listings generated a stable $495 million despite marginal decreases relative to previous cycles emphasizing recurring income potential.
Operating income for exchanges climbed 10% year-over-year affirming this segment’s role as a profit engine.
Fixed Income & Data Services: Stability in Recurring Revenues
Contrasting the episodic nature of trade-driven revenue swings in exchanges is ICE’s Fixed Income & Data Services division that recorded a steady increase in subscription revenues which grew approximately 5% year-over-year [S1]. This reflects robust demand from institutional clients for fixed income pricing data sets, analytical tools essential for portfolio risk management, plus expansion of credit default swap clearing volumes amid uncertain credit environments.
Recurring fees offer predictable cash flows supporting ICE’s broader financial health especially during muted trading periods. Investments in data delivery infrastructure enhance service scalability and provide sticky client relationships insusceptible to short-term volume shifts.
This division represents a key strategic component moderating overall earnings cyclicality inherent in capital markets operations.
Mortgage Technology: Navigating Headwinds from Rising Interest Rates
Mortgage Technology remains challenged by the sustained rise in U.S. mortgage interest rates stretching back multiple years that suppress origination volumes thus depressing transactional fee opportunities [S1]. However, operational efficiencies have begun to convert into modestly positive operating income ($14 million in 2025 versus losses exceeding $170 million previously) indicating progress toward breakeven levels.
The digital workflow platform aims to streamline end-to-end mortgage processes from application through closing supporting lenders’ efficiency gains despite a tougher consumer financing environment. Nonetheless, further rate hikes or changes in lending standards could constrain segment revenue prospects making this area susceptible to macro-financial risk factors.
Moat Assessment: Technology, Regulation, and Network Effects
ICE's competitive moat stems largely from high regulatory barriers governing exchange operations combined with proprietary technology underpinning its vast global marketplace network encompassing the NYSE as well as multiple futures venues [valye_report_excerpt]. Regulatory approval requirements limit new entrants while entrenched liquidity attracts market participants forming virtuous network effects enhancing price discovery.
Moreover, recurring revenue streams from data products and connectivity fees create sticky client relationships less sensitive to transactional cycles. Scale advantages allow for innovation in product offerings spanning asset classes assuring cross-selling synergies that reinforce market penetration.
This confluence of technology leadership plus regulatory-compliant ecosystem ensures durable structural advantages difficult for competitors to replicate rapidly.
Risk Landscape: Volatility, Regulation, and Liquidity Challenges
Even with strengths outlined above, risks remain pronounced. ICE is deeply exposed to trading volume sensitivity where abrupt declines could compress transaction revenues materially given their ~49% share of total revenues [S1]. Regulatory changes targeting fee structures or market access could also entangle compliance costs or limit pricing power intensifying margin pressure.
Liquidity ratios highlight constraints with a current ratio approximating 1.02—pointing to tight short-term funding buffers relative to obligations [F1]. Market events requiring expanded collateral or margin calls could strain operational liquidity necessitating rigorous risk controls.
Geopolitical developments such as conflicts affecting energy prices remain wildcards potentially amplifying volatility but with unpredictable impacts on overall trading activity.
Comparative Insights: ICE versus Its Financial Exchange Peers
Against peers like CME Group ([N3]), Nasdaq ([N7]), and CBOE ([N6]), ICE carves out distinct competitive niches. CME dominates in agricultural futures while ICE boasts superior exposure to energy derivatives—a sector driving outsized growth recently. Nasdaq excels in cash equities but lacks breadth across derivatives cleared at scale comparable to ICE.
Market share tilts favorably for ICE particularly where integrated data services augment core exchange functions enabling holistic client solutions not easily matched by competitors focusing narrowly on individual segments [N13]. Strategic acquisitions further broaden product depth providing differentiation in an increasingly consolidated industry landscape.
Future Outlook: Macroeconomic Trends and Strategic Positioning
Looking ahead through mid-2026 and beyond, macroeconomic uncertainty retains center stage encompassing inflation trajectories, interest rate policy shifts by central banks globally, evolving geopolitical tensions including supply chain risks related to trade policies—all factors awaiting monitoring closely by management [S1][N4][N5].
ICE’s diversified model affords some hedge against localized disruptions; however sustained low mortgage refinance activity may weigh on Mortgage Technology growth prospects while transactional gains appear linked intimately with broader economic cycles.
Strategic initiatives emphasize technology innovation—especially cloud migration—and expanding data analytics capabilities positioning the company favorably against long-term structural changes redefining financial markets operation paradigms.
Maintaining agility amid changing regulatory frameworks while enhancing platform connectivity will likely be critical success factors ensuring continued market relevance.
This analysis involves an interpretation of public filings and news reports for Intercontinental Exchange (ICE) as of early 2026 without providing investment recommendations. It aims solely at illuminating company operations within current industry contexts based on available information without projections or financial advisories.
Disclaimer: This is research-only, informational analysis and not investment advice. It may include AI-generated interpretation and general industry context. Always verify important details using primary sources.

Comments