
Triller Group Inc. Posts Steep Losses and Equity Deficit Amid Regulatory and Liquidity Pressures
Declining revenue and widening operating losses accompany Triller’s efforts to grow fintech and healthcare segments amid complex lawsuits and strained cash reserves.
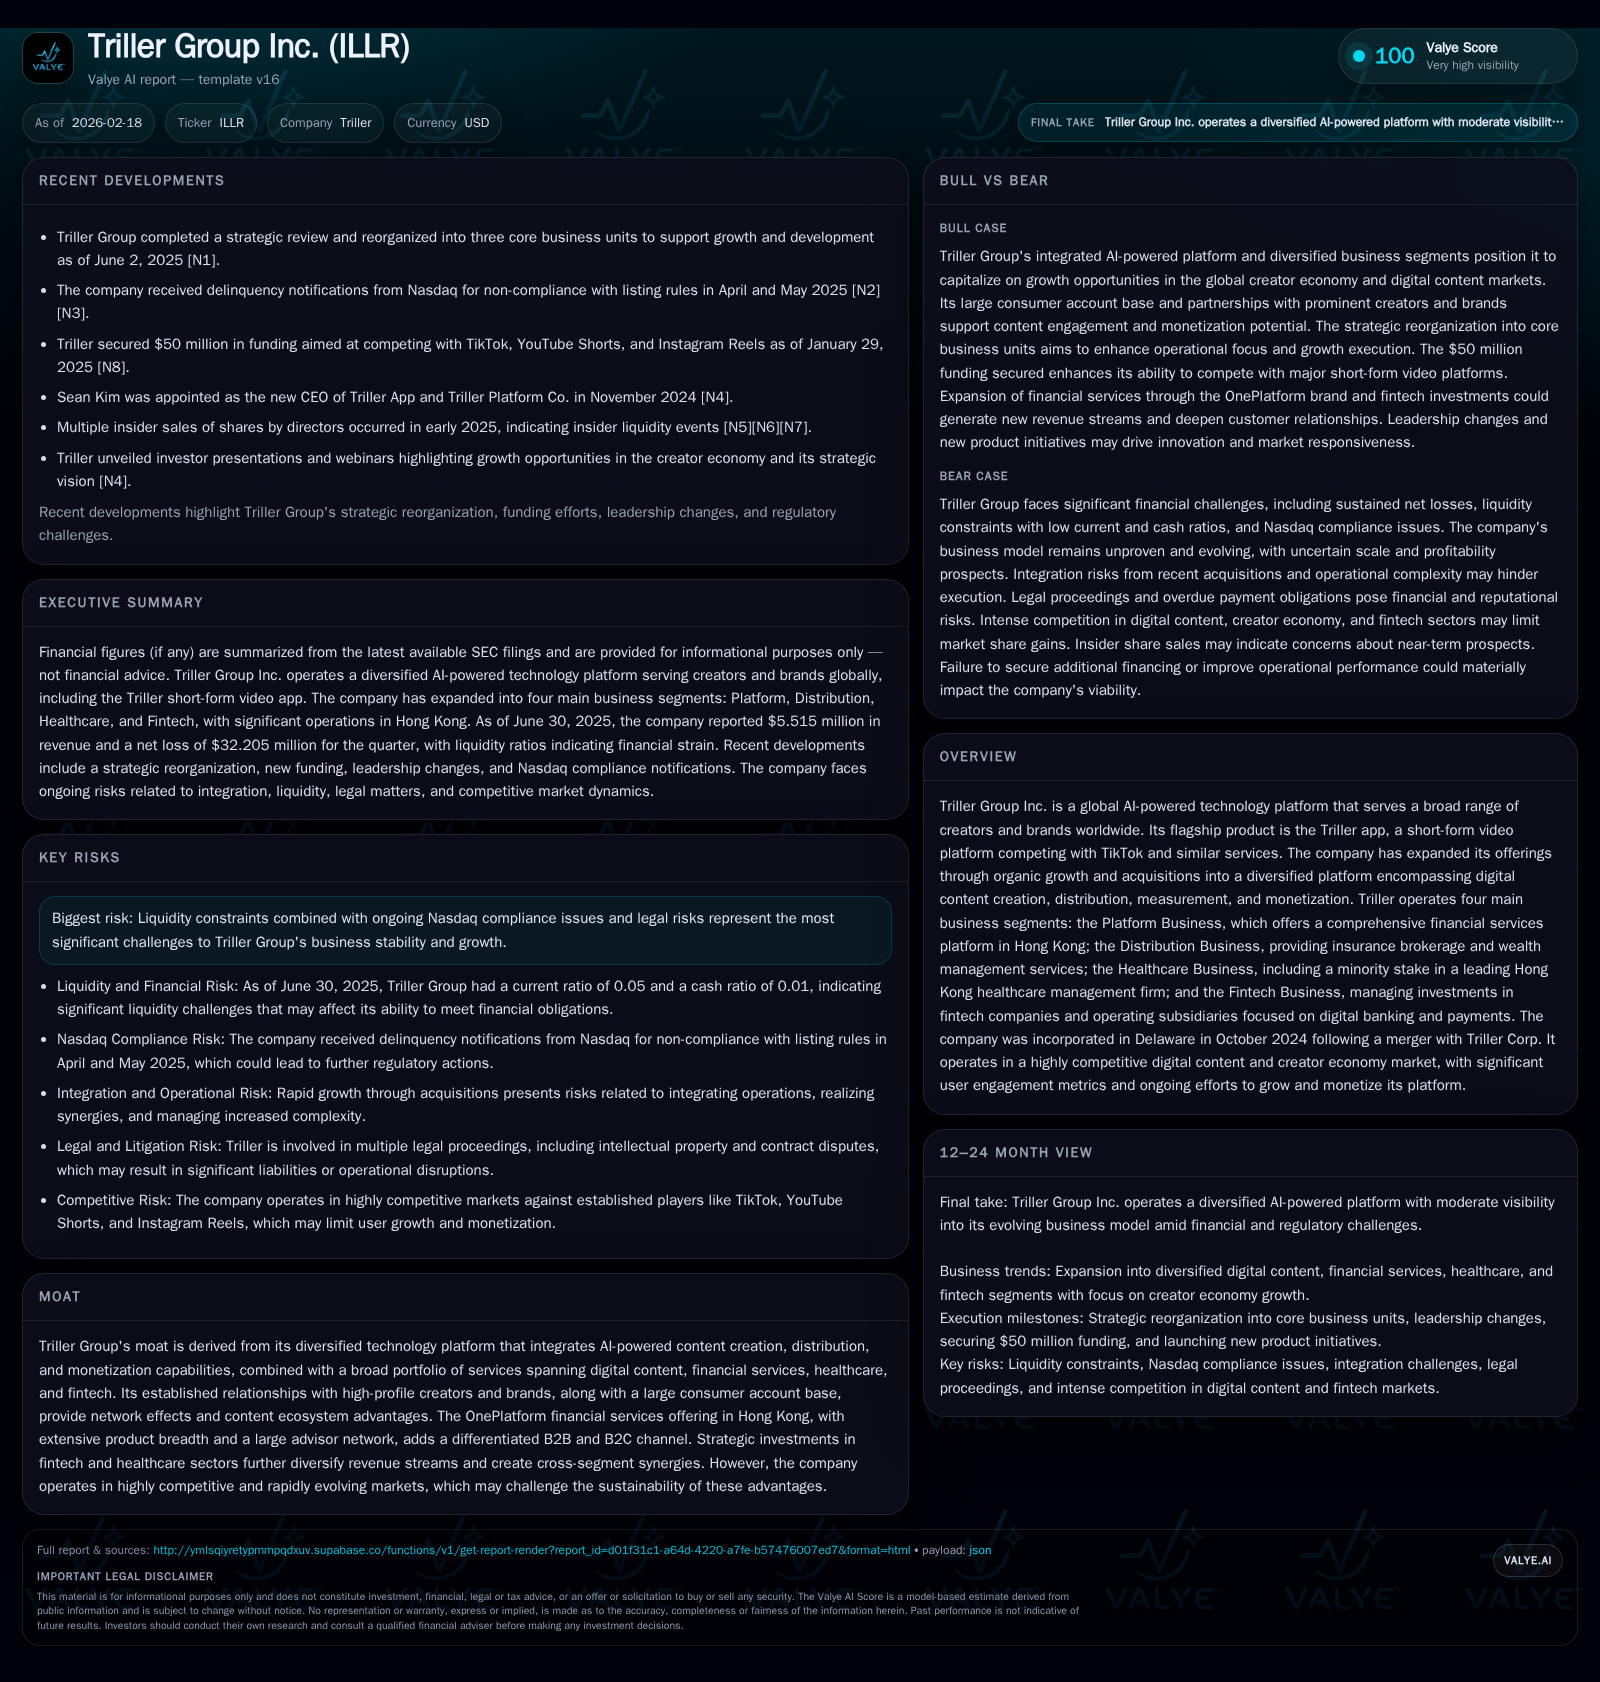
Triller Group Inc. (ILLR) manages a broad AI-powered technology platform anchored by its Triller app, alongside financial services, insurance brokerage, healthcare investments, and fintech subsidiaries primarily in Hong Kong. The company reported declining revenues from $31.1 million in FY 2022 to $27.5 million in FY 2024, with operating losses widening sharply to $113 million in FY 2024. Net losses surged dramatically to over $1.1 billion in FY 2024, reflecting significant charges not detailed explicitly in filings. Operating cash flows remain negative, with free cash flow also deeply negative amid minimal capital expenditures. Equity turned substantially negative by end-FY 2024 at -$246 million, indicating ongoing capital erosion. Regulatory risks and active litigation—including trademark disputes and class actions—compound operational uncertainties. Growth plans focus on strategic partnerships targeting Mainland China’s Greater Bay Area via Hong Kong channels, yet profitability remains elusive amid liquidity constraints and regulatory headwinds [F1][S1][S10][S15].
Company Overview and Historical Financial Performance
Triller Group Inc., trading under ticker ILLR, is a global AI-powered technology platform centered on the Triller app—a short-form video content service competing against TikTok and Instagram Reels—and diversified across financial services primarily within Hong Kong, insurance brokerage and wealth management distribution, minority healthcare investments, and fintech ventures focused on digital banking and payments [S1][S10].
The company has aggressively grown its consumer base to approximately 436 million accounts as of September 30, 2023 but has taken an uncommon step of purging over 200 million suspected bot or duplicate accounts to improve data integrity [S1].
Financially, Triller has faced significant headwinds reflected in declining revenue from $31.08 million in FY 2022 to $27.48 million in FY 2024 (-11.6% YoY). Operating income deteriorated markedly from a loss of $28.35 million in FY 2022 to a loss of $113.18 million in FY 2024 (-158%). Net income plunged further into negative territory reaching a loss of approximately $1.14 billion in FY 2024 compared with a loss of $44.52 million in FY 2022 (-2213%), likely reflecting large impairments or one-time charges not explicitly disclosed [F1].
Operating cash flows remain negative across the period (-$19.3M in FY 2022 worsening to -$29M in FY 2024), while capital expenditures remained minimal (~$100k annually), resulting in free cash flow deficits that exacerbate liquidity pressures [F1]. Shareholders' equity swung from positive $8.1 million at the end of FY 2023 to a significant deficit of -$246 million by end-FY 2024.
Historical performance (annual)
| FY | Rev ($mm) | Net ($mm) | CFO ($mm) | OpInc ($mm) | Net YoY |
|---|---|---|---|---|---|
| 2024 | 27 | -1138 | -29 | -113 | -2212.8% |
| 2023 | -49 | -42 | -44 | -10.5% | |
| 2022 | 31 | -45 | -19 | -28 | -5687.0% |
| 2021 | -1 | -1 |
Note: Omitted columns lack sufficient annual XBRL coverage in the provided tags (need ≥2 annual points): Capex, Buybacks. Source: SEC companyfacts cache [F1].
Capital returns and efficiency (annual)
| FY | Div ($mm) | FCF ($mm) | ROE% |
|---|---|---|---|
| 2024 | -29 | 462.7 | |
| 2023 | 17 | -42 | -607.3 |
| 2022 | 17 | -20 | -1072.7 |
| 2021 | 11.2 |
Source: SEC companyfacts cache [F1].
Note: Some interim year figures are unavailable or not applicable due to filing limitations.
Business Segments and Growth Outlook
Triller operates four main segments:
Platform Business: Operates "OnePlatform," a comprehensive financial services marketplace for Hong Kong's largest financial advisor network offering life insurance, pensions, property-casualty insurance, stock brokerage, mutual funds, money lending, and real estate referral services sourced from numerous providers [S10].
Distribution Business: Licensed insurance broker and Mandatory Provident Fund intermediary servicing institutional and retail clients through approximately 1,500 independent advisors mainly within Hong Kong [S10][S19].
Healthcare Business: Minority holdings within healthcare management firms offering potential synergy opportunities.
Fintech Business: Digital banking and payments operations targeting regional expansion.
Future growth strategies emphasize leveraging strategic partnerships within Mainland China's Greater Bay Area without establishing direct operations there—targeting offshore insurance solutions marketed through Hong Kong-based channels using data analytics and social media behavioral insights for customer acquisition [S15]. This cross-segment ecosystem approach aims to integrate content engagement with financial services offerings.
Regulatory Environment and Litigation Risks
Triller faces extensive regulatory complexity spanning multiple jurisdictions with specific scrutiny on data privacy laws such as the PRC Data Security Law effective early 2022 [S1], anti-monopoly enforcement policies linked to U.S.-China listing oversight like the Holding Foreign Companies Accountable Act [S24][S26], evolving fintech licensing regimes [S7][S19], as well as consumer protection statutes affecting advertising and privacy practices [S11]. Non-compliance risks include fines, revocation of licenses, reputational damage, and operational restrictions.
Active litigation includes trademark infringement appeals scheduled through late 2024 or beyond [S20], class action lawsuits alleging unpaid wages for production workers, claims over personal identifying information use by subsidiaries such as TrillerTV, and disputes related to influencer equity claims—all posing uncertain financial liabilities that could strain already limited cash reserves ($2.09 million at mid-2025) [S5][F1].
Capital Allocation and Returns Analysis
Triller’s capital structure reflects severe stress: stockholders’ equity is deeply negative (-$246 million at end-FY24), indicating substantial destruction of book value rather than returns generation. Calculated return on equity is not meaningful due to net losses vastly exceeding equity levels.
Operating cash flows are persistently negative with annual deficits exceeding $29 million alongside minimal capital expenditure ($100k), leading to sustained free cash flow outflows approximating -$29 million for the latest fiscal year [F1]. Historically paid dividends ($17 million annually through FY22-23) contrast markedly with operating losses; no recent share repurchases have been reported.
Liquidity metrics are concerning: current liabilities stand at approximately $328 million against current assets near $17 million as of mid-2025—a current ratio around just 0.05—underscoring acute solvency pressures requiring urgent financing or restructuring measures [F1][S25].
Key Metrics Summary (Latest Fiscal Year)
- Revenue: $27.48M (down YoY)
- Operating Income: -$113M (widened loss)
- Net Income: -$1.14B (significant impairment/charges)
- Operating Cash Flow: -$29M (negative)
- Capex: ~$100k (minimal)
- Stockholders’ Equity: -$246M (deficit)
- Current Ratio: ~0.05 (liquidity concern)
- Dividends Paid: Not available for latest year; historically ~$17M annually until FY23
- Buybacks: No recent activity reported
Outlook Considerations for Investors
With no explicit forward guidance provided ([N#] tags unavailable), investors should monitor:
- Progress on Mainland China Greater Bay Area partnerships converting client referrals into revenue streams via Hong Kong platforms.
- Resolution outcomes for major ongoing litigations impacting liquidity or prompting settlement costs.
- Regulatory developments affecting fintech licensing scopes or data privacy compliance that may constrain operations or increase compliance costs.
- Cash runway sustainability amid persistent operating deficits without evident profit inflection points.
- Execution success on cross-segment synergies integrating content creation with financial service monetization.
The company’s path toward sustainable profitability faces significant challenges posed by competitive market dynamics combined with complex regulatory environments affecting core business lines across content platforms and financial services.
Disclaimer: This analysis is based solely on publicly available SEC filings as of February 18, 2026 ([F1]) and associated regulatory disclosures ([S#]). It does not constitute investment advice or endorsement regarding Triller Group Inc.'s securities or prospects.
Disclaimer: This is research-only, informational analysis and not investment advice. It may include AI-generated interpretation and general industry context. Always verify important details using primary sources.
Comments