
Ingram Micro’s Accelerated Profit Growth Supported by Global Reach and Cloud Transition
The company leverages its extensive network and digital platform to capitalize on technology trends while managing leverage and competitive risks.
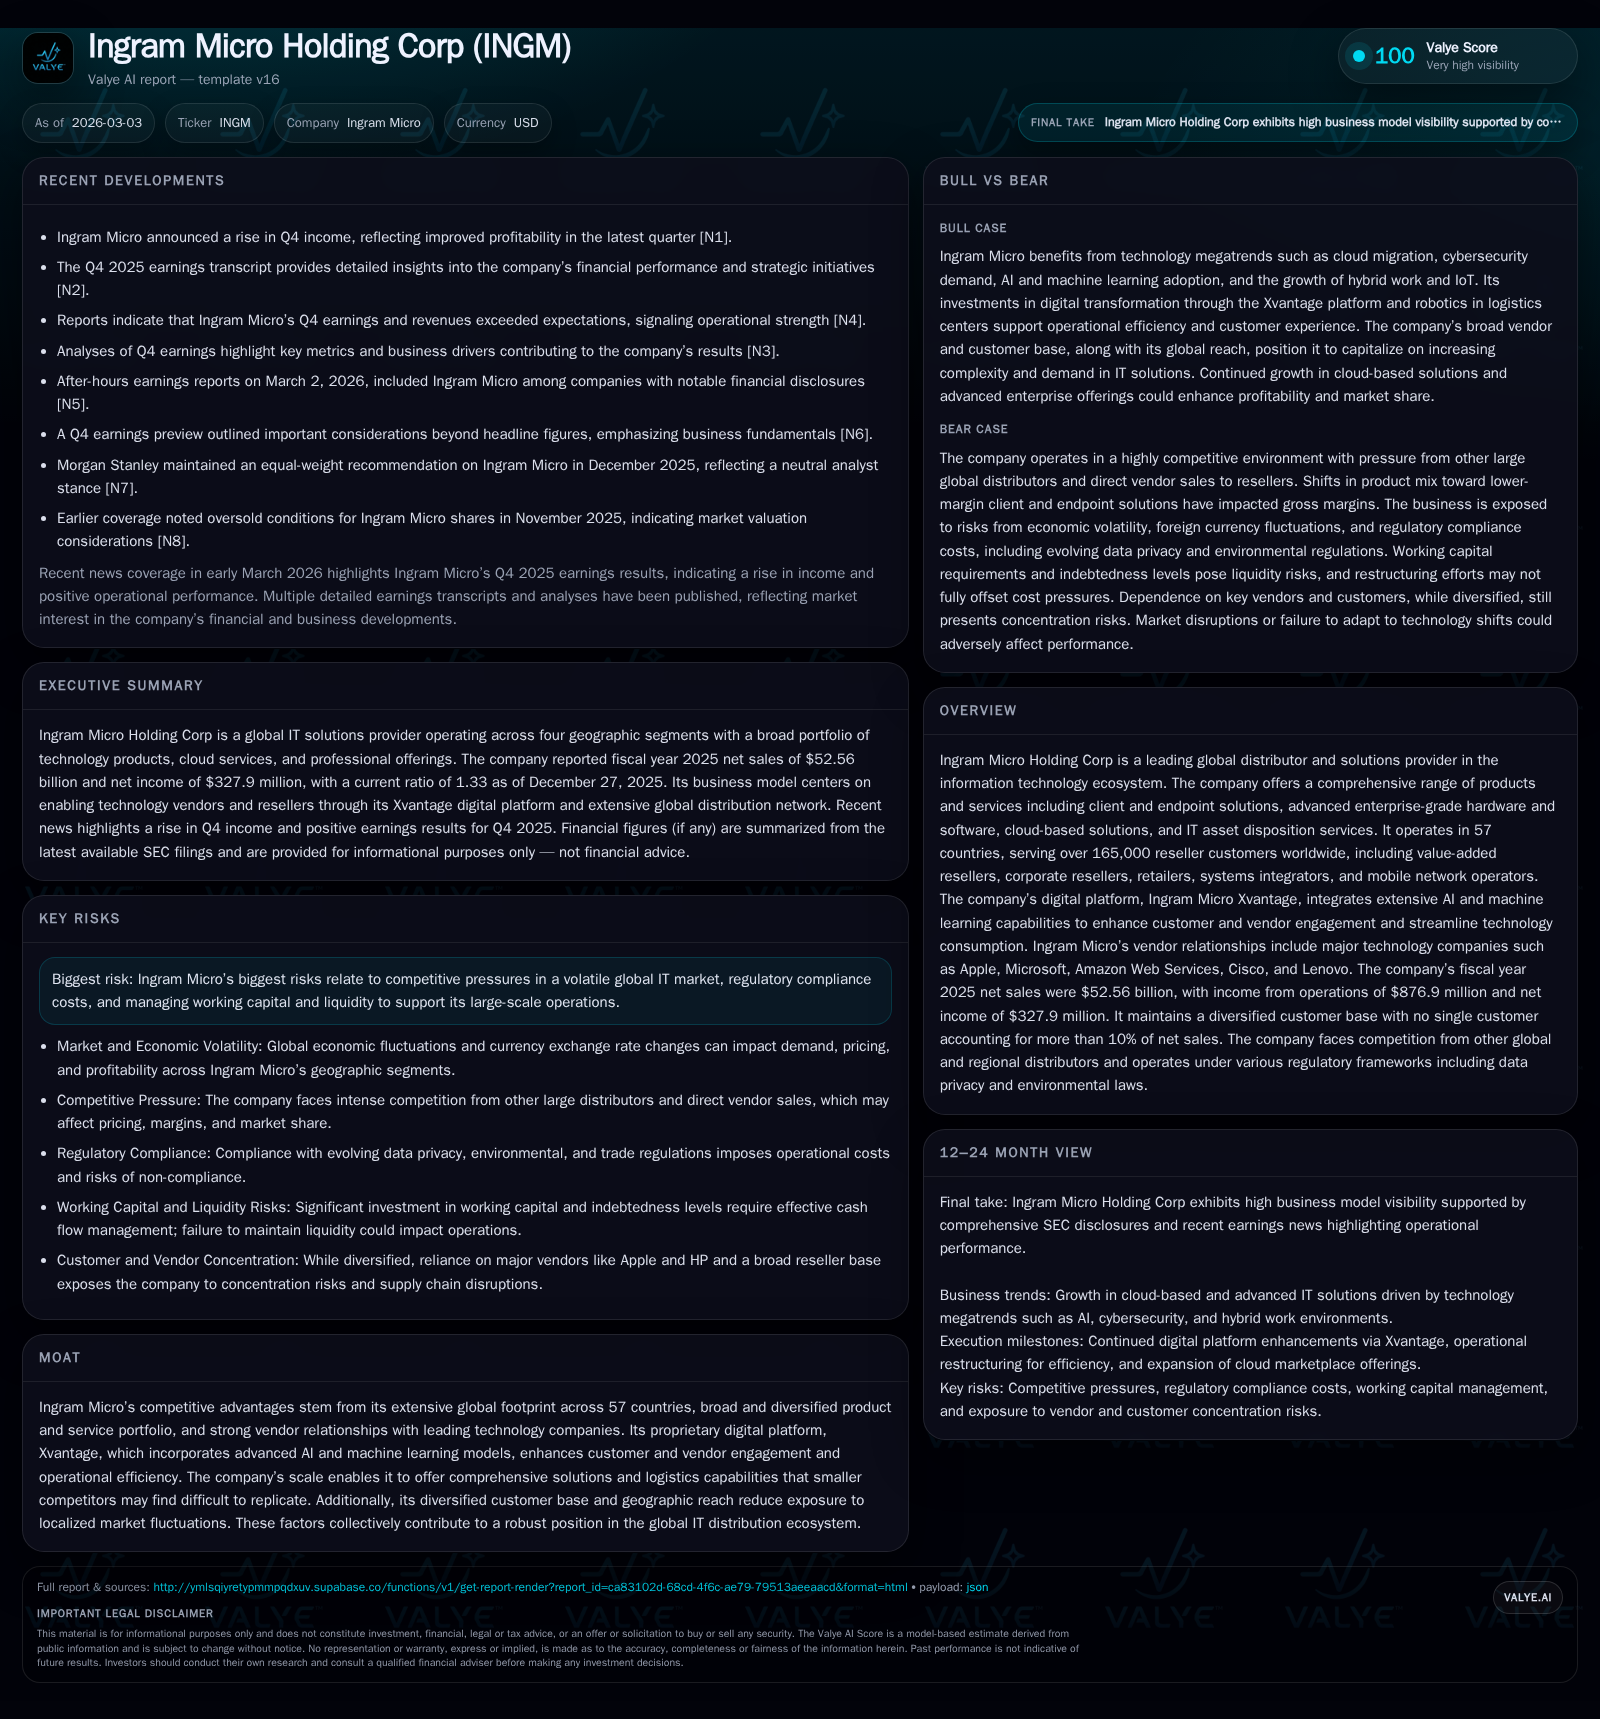
Ingram Micro Holding Corp reported strong fiscal 2025 financial results driven by broad-based sales growth across geographic regions, supported by an accelerated shift towards cloud-based and advanced IT solutions. Operating income surged nearly 253% year-over-year, reflecting improved operational efficiencies and a favorable product mix despite some margin pressure from a tilt toward lower-margin client endpoint products. The firm’s global footprint spanning 57 countries and diverse customer base underpin its competitive moat alongside the proprietary Xvantage platform enhancing supply chain and sales operations. However, debt leverage and market volatility remain key risks amid ongoing IT industry competition.
Company Overview
Ingram Micro Holding Corporation is a preeminent global distributor and solutions provider in the information technology ecosystem, operating in four principal geographic segments: North America, Europe-Middle East-Africa (EMEA), Asia-Pacific, and Latin America. It supports over 165,000 reseller customers worldwide through a comprehensive portfolio that includes client and endpoint hardware/software solutions, advanced enterprise-grade IT products, cloud-based services, and IT asset disposition (ITAD) offerings [S1]. Key vendor partnerships include major IT brands such as Apple, Microsoft, AWS, Cisco, and Lenovo. The company emphasizes building its proprietary Ingram Micro Xvantage platform—a digitally integrated B2B marketplace embedding more than 400 AI/ML models—to streamline transactions and optimize vendor-reseller interactions.
Historical Performance — FY 2023-2025
In fiscal 2025 (year ended December 27, 2025), Ingram Micro posted total net sales of approximately $52.56 billion, marking a solid increase of about 9.5% over fiscal 2024’s $47.98 billion [F1]. This growth was fueled by robust sales across all four regions—North America rose about 9.1%, Asia-Pacific surged 15.3%, EMEA expanded by approximately 6.6%, while Latin America grew modestly at just over 3% [S16].
Operating income experienced a remarkable surge of nearly 253%, reaching approximately $877 million in FY2025 compared to only around $249 million in FY2024 [F1]. This jump reflects improved operating efficiencies aided by scale effects as well as operational disciplines including channel optimization embedded within Xvantage-driven processes [N1][S15]. Similarly, net income soared almost threefold to about $328 million from roughly $83 million the prior year—aligning with stronger top-line growth and reduction in certain non-recurring charges [F1].
Operating cash flow significantly improved as well—from approximately $334 million in FY2024 to about $916 million in FY2025—leveraging higher profitability alongside rigorous working capital management despite increased receivables due to billing mix effects near year-end [F1]. Capital expenditures decreased modestly by nearly 8.4% to roughly $131 million as the company continues to invest selectively in automation technologies within its logistics networks without expanding fixed asset base substantially [F1][S16]. Dividends paid rose materially to nearly $78 million from just over $6 million prior year reflecting cash flow comfort yet moderate payout ratio given ongoing debt levels [F1].
Historical performance (annual)
| FY | Net ($mm) | CFO ($mm) | OpInc ($mm) | Capex ($mm) | Net YoY |
|---|---|---|---|---|---|
| 2025 | 328 | 916 | 877 | 131 | +294.5% |
| 2024 | 83 | 334 | 249 | 143 |
Source: SEC companyfacts cache [F1].
Capital returns and efficiency (annual)
| FY | Div ($mm) | FCF ($mm) | ROE% |
|---|---|---|---|
| 2025 | 78 | 785 | 7.7 |
| 2024 | 6 | 191 | 2.2 |
Source: SEC companyfacts cache [F1].
The above table summarizes fiscal annual financial performance across key metrics highlighting robust growth paired with improved operating leverage.
Drivers Behind Past Growth
Several complementary dynamics fostered this company’s recent performance acceleration:
- The rapid industry migration from traditional on-premises IT infrastructure toward cloud-based solutions has boosted demand for cloud offerings where Ingram Micro holds distinct advantages due to existing vendor ties and flexible solution catalogs exceeding 200 cloud services worldwide [S23].
- Continued investments in AI-driven automation within distribution centers enabled reduced fulfillment costs even amid volume growth contrasting competitors challenged by labor cost inflation [S16].
- Geographic diversification spreads exposure reducing volatility; expansions particularly elevated growth in high-potential emerging markets like Asia-Pacific due to rising IT penetration rates coupled with relatively lower capital costs per unit shipped compared with mature regions [S11][S18].
- The proprietary digital Xvantage platform acts not merely as an e-commerce portal but a layered AI-powered ecosystem connecting vendors directly with resellers worldwide optimizing inventory replenishment signals along with personalized marketing activities enhancing conversion rates globally.
Future Growth Prospects
Looking ahead into fiscal years beyond 2025, Ingram Micro’s trajectory appears aligned with macro technology adoption trends that increasingly favor:
- Ongoing cloud migration fueling demand for subscription-based IT services (XaaS), benefiting higher-margin cloud portfolios embedded within their solutions suite.
- Expansion of advanced enterprise-grade solutions focused on data center infrastructure modernization including AI-capable servers, cybersecurity suites, hybrid software-defined networking assets—all requiring complex logistic expertise that Ingram Micro’s scale uniquely provides [S23].
- Strengthening of vendor ecosystems especially via deepened integrations on Xvantage offering to accelerate partner onboarding processes leveraging machine learning models representing 'agentic AI' capabilities quickly adapting expertise at scale.
- Selective geographic expansion into underserved emerging markets will also provide incremental volume uplift without commensurate capital intensity given existing minimal automation needs.
Nonetheless, constraints include intensifying competition placing pressure on pricing; fluctuations in demand from macroeconomic uncertainty impacting discretionary IT spend; technological product obsolescence risks necessitating vigilant inventory management; complexities introduced by evolving regulatory environments affecting cross-border trade compliance costs; and the company’s substantial leverage limiting financial agility until debt amortization progresses further [S28].
Forecasts / Milestones / Monitoring Points
Although explicit forward-looking guidance was not disclosed formally in recent filings or earnings transcripts, key indicators warranting close observation include:
- Revenue growth rates segmented by line of business (e.g., relative momentum between Client & Endpoint versus Cloud-based Solutions)
- Margins trends especially gross margin shifts related to product category mix changes or vendor rebate variability impacting profitability.
- Operating expense cadence considering ongoing investments into technology platforms coupled with wage inflation pressures.
- Working capital metrics —turnover ratios for inventory and receivables—crucial for sustaining healthy cash flow generation particularly given sizeable trade credit extended.
- Debt maturity profile execution relative to liquidity cushions including availability under revolving credit facilities which currently show no borrowings but may be utilized for flexibility if required ([S6], [S10]).
These factors combined will shape medium-term operational outcomes alongside strategic development execution.
Returns and Capital Allocation
For fiscal year ending December 27, 2025:
- Return on Equity approximates a modest ~7.7%, calculated using net income of $327.9 million divided by equity of about $4.25 billion reflecting current profits relative to invested shareholders’ capital [F1].
- Operating Cash Flow reached an impressive $916 million providing ample coverage for capital needs after deducting capex expenses totaling roughly $131 million resulting in estimated free cash flow near $785 million supporting ongoing investment activities while maintaining prudent liquidity buffers [F1].
- Dividend payments surged strongly indicating the board’s willingness to distribute excess cash generated alongside reinvestments especially as leverage ratios improve gradually through repayments of term loan credit facilities ([S5],[S9]).
Significantly large outstanding debt balances remain notable at approximately $3.2 billion drawn across multiple facilities ranging through maturities up to year-end decade horizons ([S5]–[S10]). These financing structures impose customary operational covenants restricting further indebtedness or excessive distributions which could constrain aggressive buybacks or incremental dividend raises though help safeguard lender protections during market downcycles.
Competitive Moat and Strategic Positioning
The combination of expansive country footprint covering over half the globe’s population; multifaceted product/service lines serving complex customer demands; entrenched relationships with leading vendors securing supply continuity during volatile periods; along with differentiated digital capabilities embedded into their operating model creates a powerful competitive moat that is difficult for most rivals—especially smaller or regional distributors—to replicate fully.
Emerging capabilities around agentic AI via Xvantage demonstrate forward-looking innovation addressing critical pain points such as supply chain visibility delays; mismatched inventory positioning; lackluster customer personalization—all significant industry challenges currently undergoing digitization transformation.
Risk Profile Summary
The chief risks confronting Ingram Micro include:
- High leverage increasing sensitivity to changes in interest rates or credit market disruptions potentially restricting access or increasing borrowing costs.
- Intensifying price competition compressing already narrow gross margins amplified by shifts toward low-margin client endpoint products as highlighted recently ([S22]).
- Operational complexity managing a large global supply chain exposed to geopolitical uncertainties including tariff regimes or export restrictions affecting cross-border flows ([S28]).
- Potential disruption from technology transitions outpacing corporate adaptability or causing inventory obsolescence necessitating write-downs impacting earnings volatility ([S15]).
- Significant shareholding concentration held by Platinum Equity creating dependency risk upon their capital strategy decisions including possible stock sell-offs or strategic moves impacting stock price sentiment ([S2]).
Conclusion
Ingram Micro Holding Corp has delivered markedly improved profitability fueled by strategic investment prioritizing cloud adoption trends augmented by broad global reach optimized through digital innovations embedded deeply across operations via its Xvantage platform. While operating leverage gains are evident underpinning this acceleration accompanied by strong free cash flow generation enabling enhanced dividends amidst elevated debt service obligations, careful monitoring remains essential on evolving market conditions including competitive dynamics plus debt-related financial flexibility constraints.
Given its integral role spanning multiple technology segments worldwide combining logistics muscle with platform-enabled service delivery innovation positions Ingram Micro well within the evolving IT distribution landscape framed increasingly around hybrid cloud ecosystems powered by AI-enabled decision intelligence.
This analysis is based solely on publicly available information provided in SEC disclosures, recent earnings reports, and industry commentary without any forward-looking investment recommendations or opinions expressed herein.
Disclaimer: This is research-only, informational analysis and not investment advice. It may include AI-generated interpretation and general industry context. Always verify important details using primary sources.
Comments