
Ares Real Estate Income Trust's Expanding Portfolio Contrasts Persistent Net Losses
Despite significant portfolio growth and rising revenues, Ares Real Estate Income Trust continues to grapple with widening net losses amid stable cash flows and diversified lease structures.
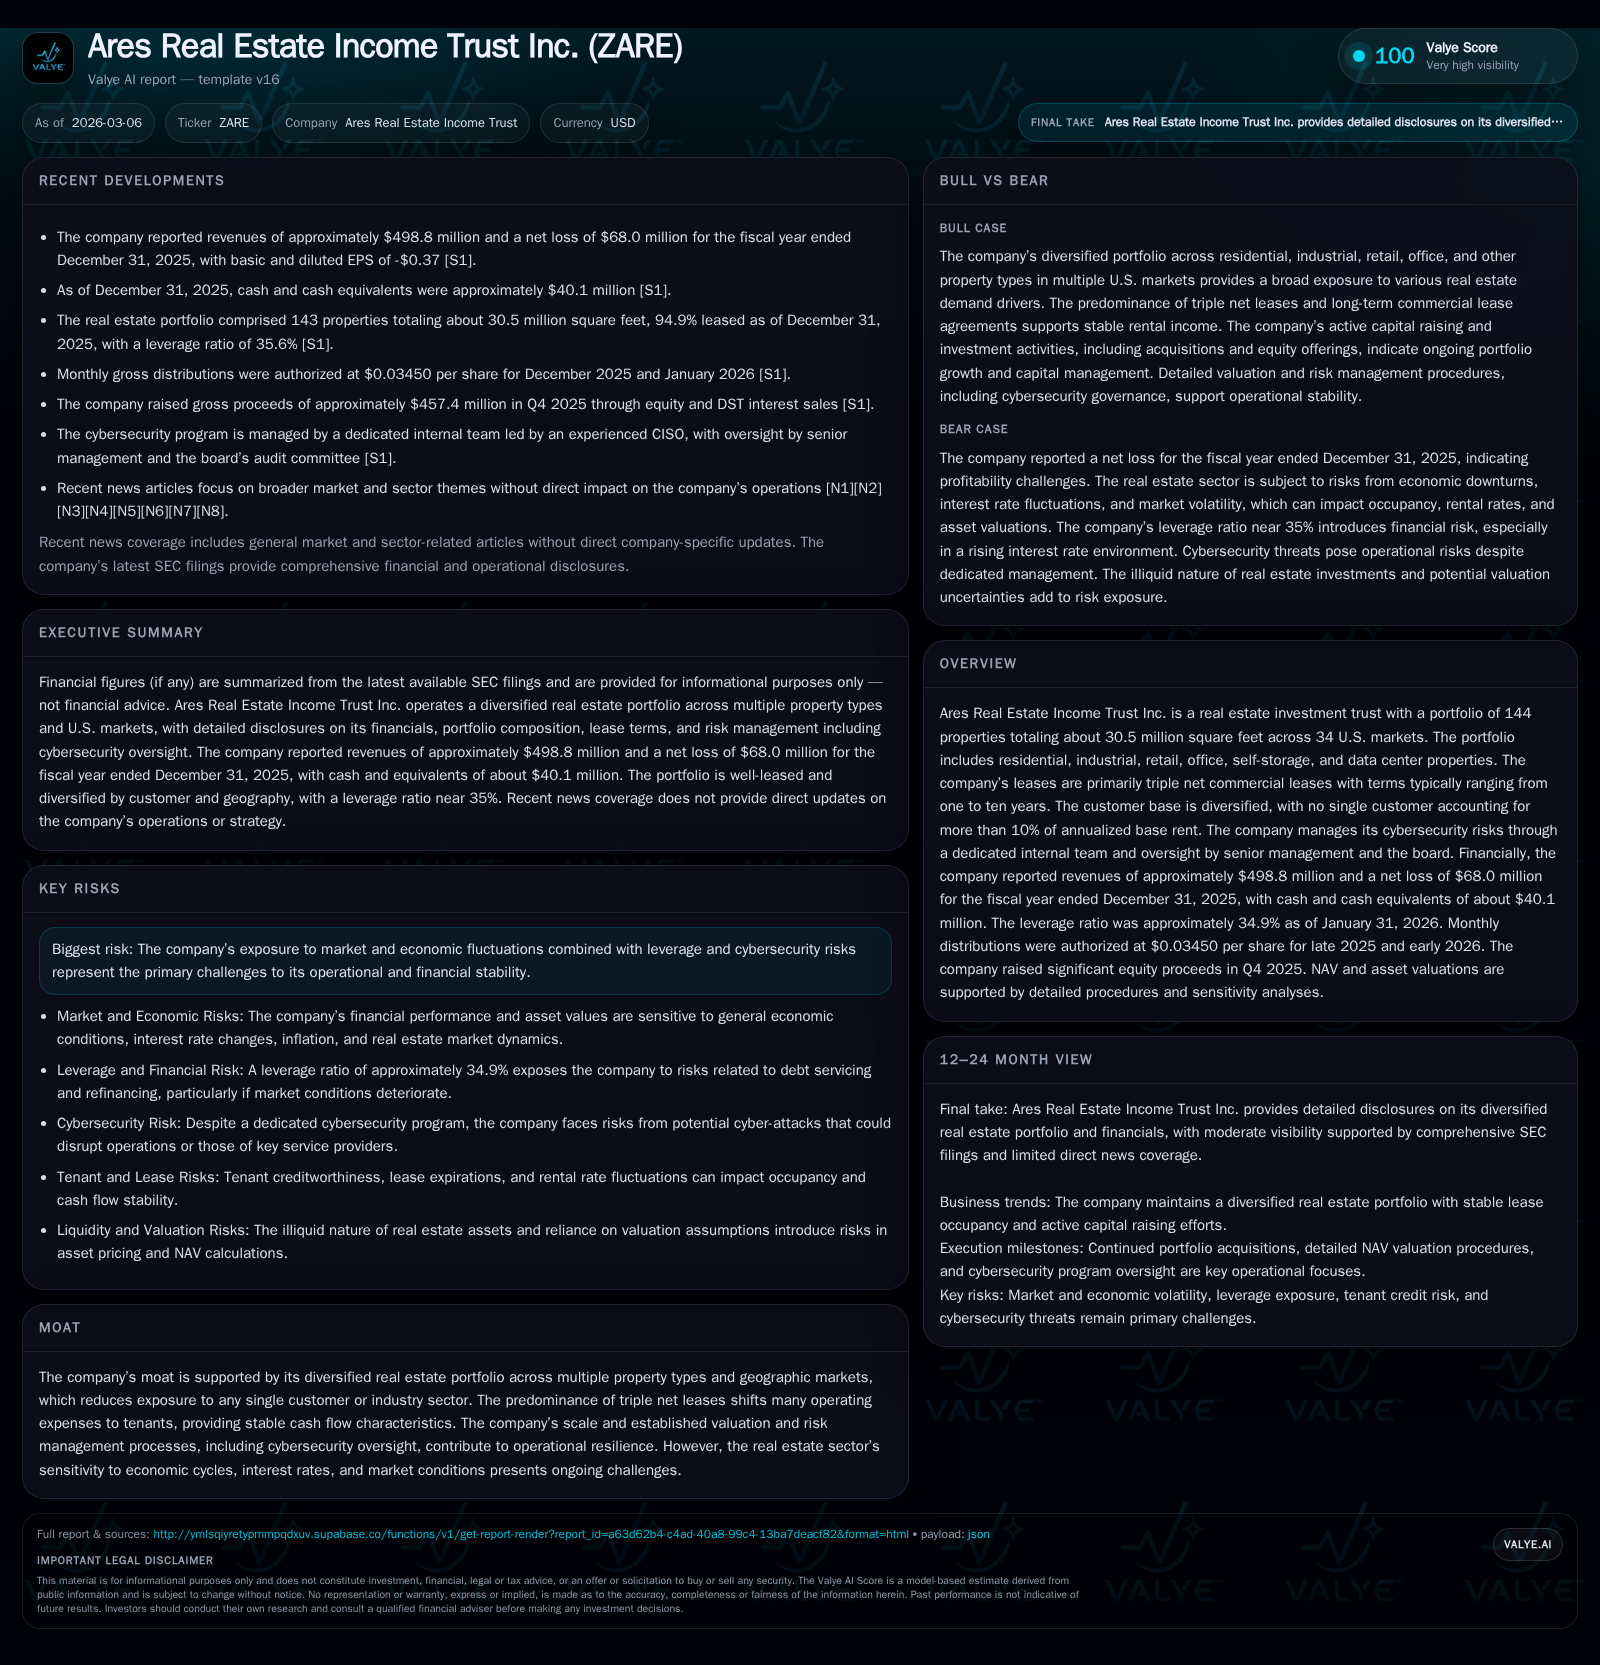
Ares Real Estate Income Trust Inc. has expanded its portfolio to 144 properties totaling over 30 million square feet across 34 U.S. markets, achieving nearly 20% annual revenue growth by the end of 2025. The trust benefits from a diversified asset base—including residential, industrial, retail, office, self-storage, and data center properties—with approximately 95% leased occupancy largely under triple net leases, underpinning cash flow stability. Despite improving operating income and a strong operating cash flow turnaround, persistent net losses reflect underlying expense pressures and financing costs. The company maintains a leverage ratio near 35% with a weighted average borrowing cost around 4.85%, alongside disciplined capital allocation featuring sizable dividends and share repurchases. Cybersecurity governance and tenant diversification mitigate operational risks, while the lease maturity profile requires renewal vigilance. Looking ahead, monitoring NAV updates, rent re-pricing trends—especially in industrial—and refinancing cycles will be key to assessing value creation potential.
Historical Performance Overview
Ares Real Estate Income Trust has shown consistent growth through fiscal year-end December 31, 2025. Revenues rose from $299 million in FY2022 to nearly $499 million in FY2025, representing an approximate compound annual growth rate near 20% [F1]. Operating income also improved steadily, reaching $332 million most recently.
Despite these operational gains, net income remains negative and has worsened from -$40 million in FY2022 to -$68 million in FY2025. This divergence stems largely from non-operating factors such as financing costs or impairments not detailed here [F1].
Operating cash flow highlights a recovery trend following volatility; after a negative $169 million outflow in FY2024, cash flow from operations surged back to $254 million positive in FY2025.
Historical performance (annual)
| FY | Rev ($mm) | Net ($mm) | CFO ($mm) | OpInc ($mm) | Rev YoY | Net YoY |
|---|---|---|---|---|---|---|
| 2025 | 499 | -68 | 254 | 332 | +19.5% | -83.1% |
| 2024 | 417 | -37 | -169 | 281 | +18.2% | +40.5% |
| 2023 | 353 | -62 | 16 | 234 | +18.0% | -56.1% |
| 2022 | 299 | -40 | 63 | 185 |
Source: SEC companyfacts cache [F1].
Capital returns and efficiency (annual)
| FY | Div ($mm) | Buybacks ($mm) | ROE% |
|---|---|---|---|
| 2025 | 95 | 94 | -10.4 |
| 2024 | 78 | 153 | -5.0 |
| 2023 | 61 | -7.8 | |
| 2022 | 50 | -5.1 |
Source: SEC companyfacts cache [F1].
Table: Key financial metrics sourced from latest SEC filings and company facts [F1].
Portfolio Composition and Lease Structure
The trust's portfolio encompasses residential, industrial, retail, office, self-storage, and data center properties spread across thirty-four U.S. metropolitan markets totaling roughly 30.5 million square feet as of January 31, 2026 [S6,S8]. This diversification limits concentration risks.
Approximately ninety percent of commercial leases are triple net arrangements where tenants cover property taxes, insurance, maintenance, and other expenses — supporting predictable cash flows [S6]. Lease terms vary from one to ten years with renewal options.
Industrial leases have demonstrated robust rent growth: comparable lease rents increased by about +33% on a cash basis during the trailing twelve months ended December 31, 2025; GAAP rental rates reflected even higher increases at +53%. Residential rents experienced slight declines averaging -1.7%, highlighting sector-specific differences [S8].
Occupancy rates remain strong at about ninety-five percent across the portfolio.
Net Losses Amid Operational Growth
Persistent net losses despite rising revenues and operating income are attributed primarily to financing costs associated with leverage (approximately thirty-five percent debt ratio) and potential non-cash impairments or valuation adjustments impacting earnings negatively [F1,S14,S15].
The weighted average cost of debt stands near four point eight five percent, exerting pressure on profitability even as core operations improve.
Lease Maturity & Tenant Diversity
Lease expirations are staggered over the coming decade with weighted-average remaining terms around five point seven years for commercial leases based on annualized base rent [S12]. A significant portion of lease expirations cluster between calendar years twenty twenty-six through twenty thirty.
| Year | Number of Leases | Annualized Base Rent ($K) | % of Total Annualized Base Rent |
|---|---|---|---|
| 2026 | 62 | 17,981 | 7.3% |
| 2027 | 69 | 24,721 | 10.0% |
| 2028 | 91 | 34,699 | 14.0% |
| 2029 | 74 | 31,839 | 12.8% |
| 2030 | 73 | 28,915 | 11.7% |
No single tenant accounts for more than ten percent of annualized base rent or leased square footage as of December 31, 2025; Amazon / Whole Foods is the largest tenant at approximately seven point six percent providing diversification benefits [S5,S6]. Tenant creditworthiness is regularly assessed with security deposits or guarantees required as appropriate.
Capital Allocation Focus: Dividends & Buybacks
Capital deployment balances growth initiatives with shareholder returns: dividends paid increased steadily to about ninety-four point six million dollars for fiscal year twenty twenty-five while share repurchases reached roughly ninety-four million dollars through Q3 twenty twenty-five reflecting capital return discipline [F1,S8,S15].
Acquisitions remain active with six properties (four industrial and two data centers) acquired during Q4 twenty twenty-five for over seven hundred sixty-eight million dollars demonstrating continued portfolio expansion focus [S8].
Liquidity management includes equity raises combined with orderly redemptions offsetting dilution effects.
Risk Management: Cybersecurity & Financial Controls
Cybersecurity oversight is managed internally by an experienced Chief Information Security Officer who reports regularly to board committees ensuring proactive mitigation against digital threats that could disrupt operations or service providers integral to revenue generation [S1,S7].
Financial risk is contained through maintaining leverage near mid-thirties percentage relative to independently appraised asset values updated quarterly; interest rate exposure is monitored given borrowing costs near current market levels around high four percents [S14,S15].
Outlook & Key Milestones Ahead
While formal guidance is not provided,[N3,S3] key forward-looking indicators include:
- Ongoing acquisitions prioritizing high-growth sectors like industrial and data centers benefiting from favorable rental trends.
- Market conditions including inflationary pressures impacting vacancy risk notably within retail and office segments.
- Divergent rent re-pricing trends favoring industrial assets contrasted by modest softness in residential rentals requiring careful portfolio management.
- Regulatory changes influencing REIT taxation potentially affecting capital allocation flexibility.[S4]
- Regular NAV updates reflecting refined discount rates and liability valuations following board procedural amendments enhancing transparency.[S3]
- Lease renewals during the late twenties will test ability to sustain rent growth momentum amid evolving market dynamics.[S12]
- Debt refinancing aligned with interest rate environment will impact long-term cost structures and liquidity positions.[S11]
Monitoring these factors will be essential for assessing value creation opportunities and the sustainability of expanding cash flows translating into profitability improvements.
This analysis is based exclusively on publicly available SEC filings ([S#]), company financial data ([F1]), and relevant news sources ([N#]). It does not constitute investment advice.
Disclaimer: This is research-only, informational analysis and not investment advice. It may include AI-generated interpretation and general industry context. Always verify important details using primary sources.
Comments