
JAKKS Pacific: Balancing Evergreen Brands and Competitive Pressures in Toy Markets
JAKKS Pacific leverages a portfolio of licensed evergreen brands amid tightening revenue and profit margins shaped by evolving consumer preferences and industry competition.
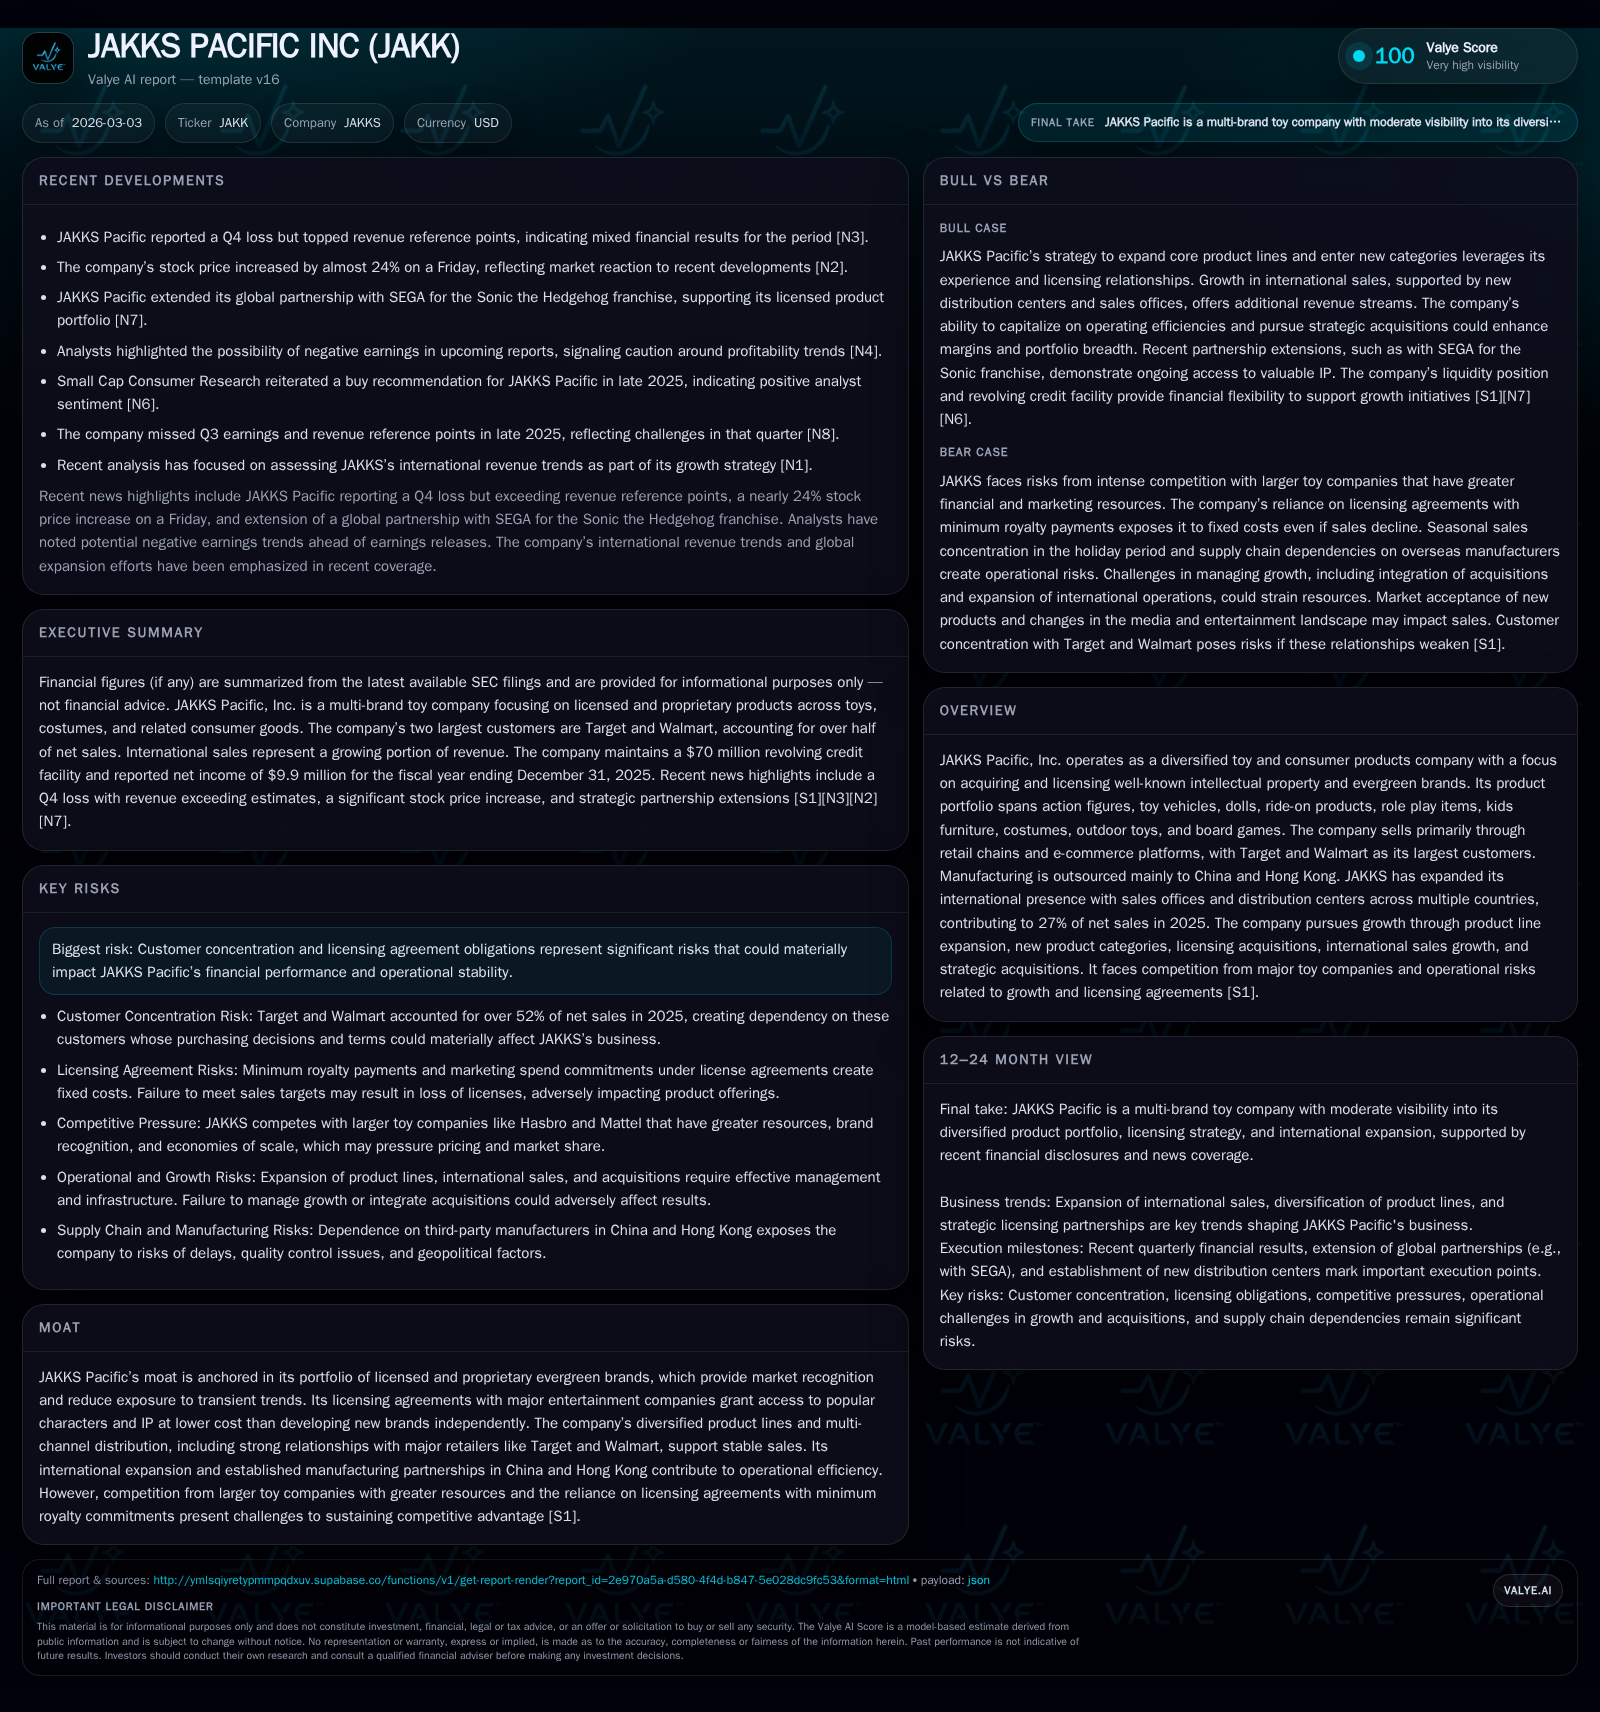
JAKKS Pacific’s historical financials reveal a significant downward trend in revenue, operating income, and net income from 2024 to 2025, despite stable brand licensing strategies. The company’s diversified product portfolio—from action figures to kids’ furniture—faces growing challenges from shortened product lifecycles and shifting consumer behaviors favoring tech-enhanced toys. International expansion, contributing 27% of sales in 2025, offers growth potential but increases operational complexity. Liquidity remains pressured with sharply declining operating cash flow and negative free cash flow, even as dividends are maintained. Customer concentration with Target and Walmart, along with licensing royalty commitments, constitute notable risks for JAKKS moving forward.
From Evergreen Licenses to Top-line Pressures: Reviewing Historical Growth
JAKKS Pacific’s financial trajectory over recent years underscores the tension between the strength of its evergreen licensed brands and the pressures mounting on revenue and profitability. According to the latest annual report, the company’s revenue fell to approximately $331 million in fiscal year (FY) 2025—a decline of 13.7% compared with FY2024 [F1]. Operating income plunged more steeply by 64.2%, dropping to $14.2 million in 2025 from nearly $39.7 million in the prior year. Net income slumped by over 70%, closing at $9.9 million for FY2025 [F1]. Operating cash flows contracted significantly as well (-78.2%), reaching under $8.5 million while capital expenditures—though slightly reduced by about 15%—still exceeded cash flow generation, contributing to negative free cash flow.
Historical performance (annual)
| FY | Net ($mm) | CFO ($mm) | OpInc ($mm) | Capex ($mm) | Net YoY |
|---|---|---|---|---|---|
| 2025 | 10 | 8 | 14 | 10 | -70.9% |
| 2024 | 34 | 39 | 40 | 11 | -11.7% |
| 2023 | 38 | 66 | 59 | 9 | -58.0% |
| 2022 | 91 | 86 | 61 | 10 |
Source: SEC companyfacts cache [F1].
Capital returns and efficiency (annual)
| FY | FCF ($mm) | ROE% |
|---|---|---|
| 2025 | -1 | 4.0 |
| 2024 | 28 | 14.1 |
| 2023 | 57 | 20.3 |
| 2022 | 76 | 62.7 |
Source: SEC companyfacts cache [F1].
This downturn signals that while JAKKS Pacific’s portfolio anchored in licensed IP provides product familiarity and some stability, it is not immune to eroding margins amid changing consumer tastes and intensified competition [S1]. Industry pressures such as shorter toy life cycles driven by high-tech competitors also play a critical role.
Core Product Lines and Consumer Shifts Reshaping Demand
JAKKS Pacific operates across a multifaceted product range comprising licensed action figures linked to legacy franchises like Nintendo® and Sonic the Hedgehog®, diverse doll lines including Disney Frozen® and Moana®, various ride-on toys bearing Hasbro® licenses, costumes tied to blockbuster properties such as Super Mario Bros., along with children’s indoor/outdoor furniture [S6][S27]. This breadth supports balanced exposure yet also challenges rapid innovation within every category.
The company acknowledges facing significant headwinds stemming from fast-evolving consumer preferences:
- Children increasingly gravitate toward interactive or technology-enriched play experiences reducing engagement with traditional toy categories.
- Consumers expect elevated product quality standards balancing function, price-value metrics, and environmental considerations.
- Marketing complexity has escalated with fragmented digital media channels supplanting conventional advertising venues.
- Transitions from brick-and-mortar retail browsing toward online discovery impact how new products gain traction [S1].
These industry-native hurdles compress the window for successful product launches—a core challenge given JAKKS’s reliance on licensing popular IP rather than proprietary content creation [S1][S6]. Thus, while licensing grants access to well-regarded characters at relatively moderate cost versus developing original brands independently, it also ties success heavily to licensor-driven content performance.
International Expansion: Growth Engine or Execution Challenge?
A salient facet of JAKKS’s strategy has been diversification into international markets where it achieved roughly $154 million in net sales outside the U.S.—representing 27% of total company revenues in FY2025 versus just over 21% in FY2024 [S4][S5]. The company supports these efforts through a network of distributors alongside direct retailer relationships in key regions including Europe (with warehouses opened recently in Germany plus additional centers across UK, Italy, Belgium, Spain), Canada, Latin America (notably Mexico warehouse capacity), Australia, and Asia [S5].
While international expansion broadens geographic exposure mitigating some domestic concentration risk prevalent among peers tied solely to U.S.-based retail chains ([S10]), this move involves typical mid-tier toy company complexities such as:
- Coordinating diverse regulatory environments impacting product safety certifications.
- Managing currency fluctuation risks as sales scale outside dollar-centric markets.
- Ensuring consistent inventory management across multiple warehouses without inflating working capital requirements.
- Preserving brand resonance abroad where IP awareness may trail behind home markets.
Such nuances suggest that although non-U.S. growth offers meaningful upside potential amid saturated domestic shelves, operational execution must remain vigilant lest costs erode incremental margin gains [S4][S17].
Competitive Context: Facing Larger Peers with Scale Advantages
The competitive landscape encompasses formidable rivals like Hasbro® and Mattel®, whose scale advantages shape sector dynamics unfavorably for JAKKS Pacific [S7]. Competitors wield greater financial muscle powering expansive marketing budgets—enabling advanced data analytics platforms supporting agile merchandising decisions—plus proprietary IP portfolios that generate ancillary higher-margin revenues not dependent solely on toy sales.
Economies of scale yield purchasing power leverage fixtures reducing per-unit costs appreciably; combined with longer operating histories these incumbents routinely secure premium shelf space placement—an area where JAKKS faces challenges given retailer concentration trends favoring dominant brands [S7].
JAKKS's smaller size amplifies vulnerability across sourcing negotiations, distributor relationships overseas, and investment capabilities necessary for rapid tech adoption within toys featuring interactive electronics or app connectivity [S7]. This disparity heightens the imperative for lean operating models allied with selective innovation enabling faster-to-market timelines amid compressed play lifecycle windows [S1][S6].
2026 Outlook — What To Watch For in Product Innovation and Market Penetration
Explicit forward guidance is not provided publicly; however, recent earnings commentary noted a Q4 loss contrasting with topline revenue beats suggesting operational headwinds remain potent [N2][N3]. Market reaction included a sharp positive stock move nearing +24%, reflecting optimism around potential upside catalysts including intensified international sales efforts or initial traction on newly reengineered products leveraging integrated technology features [N5].
Analysts should monitor developments such as:
- Speed of compressing the typical nine-to-eighteen month development cycle down toward three-month launches for opportunistic IP rollouts.
- Success renewing or acquiring licenses aligned with current media trends maintaining relevancy among younger demographics where streaming entertainment dominates consumption patterns.
- Expansion outcomes within emerging retail formats or e-commerce platforms beyond Target.com/Walmart.com including direct-to-consumer channels as consumer shopping habits evolve post-pandemic [S1][N1].
These indicators will help gauge whether JAKKS can pivot effectively through product lifecycle reinvention while leveraging its entrenched distribution network domestically and internationally.
Capital Allocation: Balancing Cash Flows, Dividends, and Investment Priorities
From a capital deployment perspective, CFO plummeted roughly four-fifths compared to prior year levels ($8.5 million vs $38.9 million), turning free cash flow slightly negative after subtracting capex ($9.6 million) used mainly for infrastructure supporting distribution footprint enhancement [F1]. Return on equity remains modest at an approximate rate of 4%, bespeaking constrained profitability despite asset base growth driven by accumulated retained earnings [F1].
Importantly dividend payments remain consistent near $11.2 million annually even amid earnings erosion highlighting management's commitment to shareholder distributions but raising questions about sustainability absent meaningful improvements in earnings or free cash flows going forward [F1][N2].
There have been no material share buybacks lately indicating prioritization toward maintaining liquidity given industry cyclicality coupled with structural pressure from royalty payments owed under licensing agreements featuring minimum guarantees regardless of sales volumes [F1][S1]. Forecasts depend critically upon stabilization of working capital management efficiencies paired with prudent capex controls.
Risks Embedded in Licensing Dependencies and Customer Concentration
JAKKS Pacific faces significant risks rooted chiefly in its license dependency framework where royalty obligations ranging broadly between low single digits up to over twenty percent of net sales impose pronounced fixed cost burdens regardless of actual volume trends [S20][S24]. Failure to renew key licenses or adverse renegotiations could impair future revenue streams considerably since several marquee properties represent cornerstone portfolio elements.
Customer concentration further magnifies risk profile: Target® accounted for approximately 26.6%, Walmart® roughly 26.1%, cumulatively representing over half the company's net sales in FY2025; Amazon®, formerly top three contributor near 10%, is no longer a major percentage contributor [S4][S10]. Such concentration inherently links JAKKS's fortunes closely with order volumes, pricing terms negotiations, inventory return policies imposed by these retailers—all factors potentially causing material swings in operating results particularly if any large customer curtails purchases or seeks concessions amid broader retail channel stressors.
Moreover absence of long-term firm purchase contracts implies orders are cancellable without penalty up until delivery complicating demand visibility [S10]. Combined with ongoing geopolitical tensions affecting China-based manufacturing partnerships supplying many SKUs alongside tariffs rolling out since mid-2025 elevates supply chain risk alongside margin squeeze potential [S16][S18].
Conclusion
JAKKS Pacific stands at an inflection point where its established position leveraging recognizable licensed trademarks confronts secular headwinds disrupting conventional toy markets worldwide. Despite resilience afforded by evergreen brand portfolios tied to iconic entertainment properties, persistent declines in revenue growth rates coupled with sharply contracting profits expose structural challenges inherent within its model—including shortened product lifecycles accelerated by digital engagement shifts plus escalating competition from global peers enjoying superior scale economies.
International expansion provides a vital avenue for incremental revenue diversification yet entails increased execution complexity demanding adept supply chain orchestration synchronized across continents under cost constraints heightened by tariff uncertainty.[F1][S4][N1]
Going forward investors would do well to scrutinize how effectively management adapts through accelerated innovation cycles integrating modern tech into product offerings while negotiating more favorable licensing terms without sacrificing core brand strength or alienating key retailers controlling majority share-of-wallet.[N5][S1]
This analysis synthesizes publicly filed financial statements and disclosures highlighted through SEC filings and recent market news without offering investment advice or predictive valuation judgments.
Disclaimer: This is research-only, informational analysis and not investment advice. It may include AI-generated interpretation and general industry context. Always verify important details using primary sources.

Comments