
JBG SMITH Properties’ Shift in Metro-Area Real Estate: From Past Hurdles to Future Horizons
JBG SMITH’s focused Metro-served mixed-use portfolio entangles asset sales with recurring management fee revenue, confronting operating losses amid a challenging capital environment.
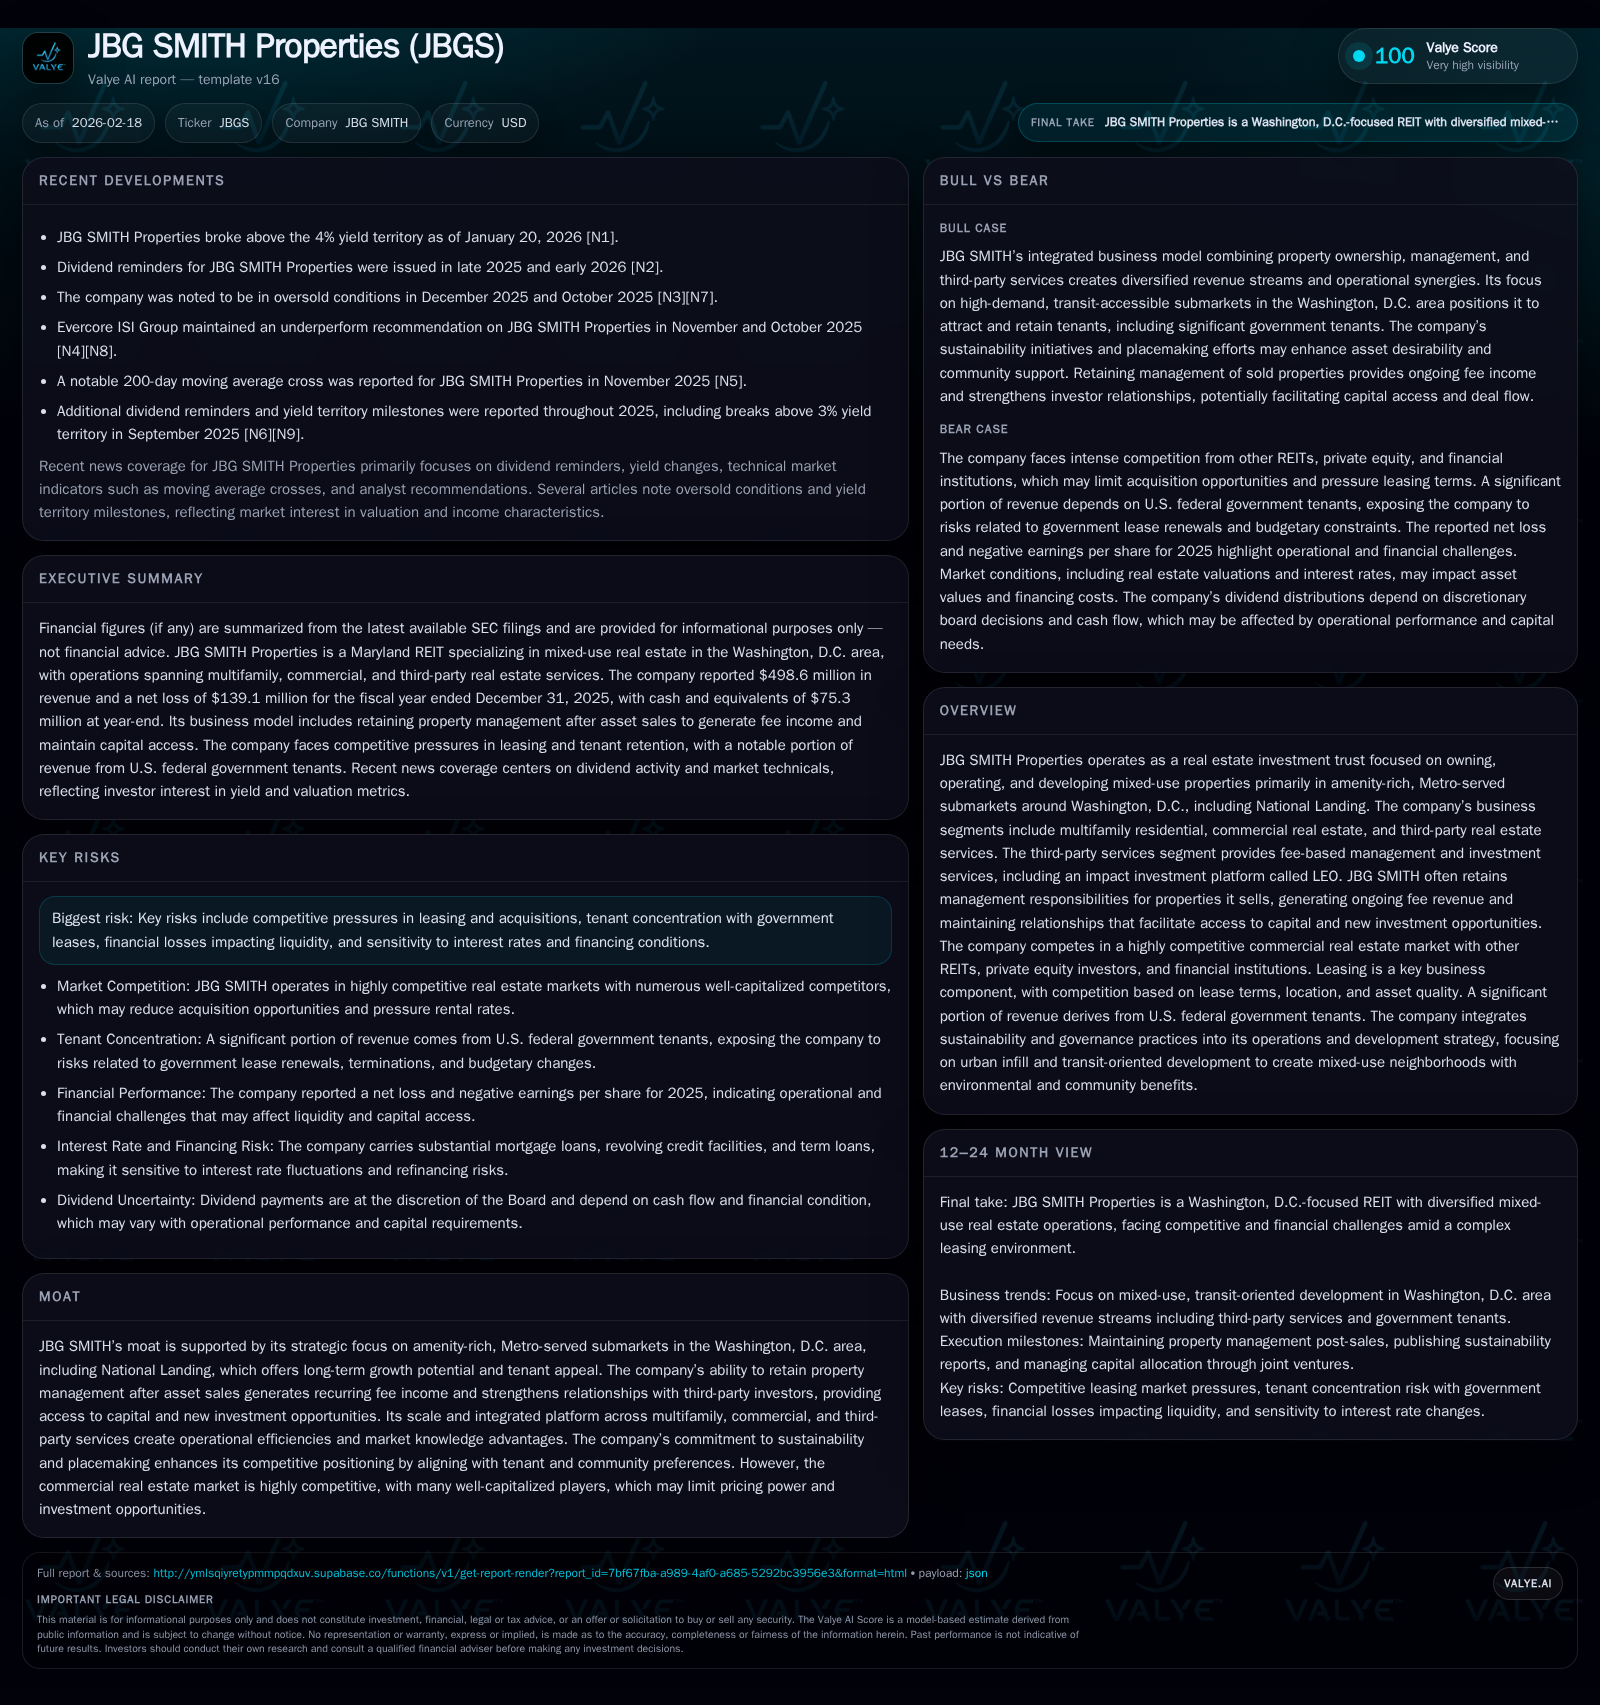
Over the past four years, JBG SMITH Properties has experienced notable contraction in revenue from $605.8 million in 2022 to $498.6 million in 2025, alongside persistent net income losses since 2023. The company’s unique niche in amenity-rich, transit-accessible submarkets around Washington, D.C., including National Landing, supports tenant appeal and underpins a strategic advantage despite intense leasing competition. Recurring property management fees from retained management post-asset sales serve as a buffer against top-line volatility. However, rising interest rates coupled with restrictive debt covenants impose refinancing risks. While JBG SMITH maintains dividends and executes opportunistic buybacks, its near-term growth is contingent on leasing momentum and development progress within a competitive market landscape.
Revenue Contraction and Profitability Challenges Over Recent Years
JBG SMITH Properties experienced a marked revenue contraction from $605.8 million in fiscal year 2022 to $498.6 million by year-end 2025, a cumulative decline nearing 18% over three years corresponding to an almost -8.9% annual growth rate when comparing FY2025 versus FY2024 [F1]. This downturn reflects a shifting portfolio mix driven by strategic asset divestitures as well as softening leasing fundamentals exacerbated by an intensely competitive metro-area market.
Net income trends further illuminate operating challenges with positive income recorded in 2022 ($85.4 million) giving way to increasing net losses beginning in 2023 (-$79.9 million), which expanded sharply through 2024 (-$143.5 million) before narrowing modestly in 2025 (-$139.1 million) [F1]. These sustained losses indicate pressures including unrealized mark-to-market impairments impacting reported profitability beyond operational cash flow realities.
Moreover, operating cash flow has suffered a significant impairment, falling from $178 million in FY2022 down to roughly $73 million in FY2025—a decrease of approximately 43.4% year-over-year—highlighting emerging constraints in cash generation capacity crucial for dividend support and capital reinvestment [F1]. Capital expenditures have been pared down by nearly 10% within the same timeframe but remain material at nearly $35 million in 2025.
Historical performance (annual)
| FY | Rev ($mm) | Net ($mm) | CFO ($mm) | Capex ($mm) | Rev YoY | Net YoY |
|---|---|---|---|---|---|---|
| 2025 | 499 | -139 | 73 | 35 | -8.9% | +3.1% |
| 2024 | 547 | -144 | 129 | 39 | -9.4% | -79.5% |
| 2023 | 604 | -80 | 183 | 63 | -0.3% | -193.7% |
| 2022 | 606 | 85 | 178 | 74 |
Note: Omitted columns lack sufficient annual XBRL coverage in the provided tags (need ≥2 annual points): OpInc. Source: SEC companyfacts cache [F1].
Capital returns and efficiency (annual)
| FY | Div ($mm) | Buybacks ($mm) | FCF ($mm) |
|---|---|---|---|
| 2025 | 48 | 444 | 38 |
| 2024 | 62 | 171 | 91 |
| 2023 | 94 | 335 | 120 |
| 2022 | 108 | 361 | 104 |
Source: SEC companyfacts cache [F1].
Note: Operating income data insufficient for multi-year trend; ROE approximated separately.
Leveraging Metro-Served Mixed-Use Assets to Sustain Tenant Appeal
JBG SMITH’s moat derives strongly from its concentrated focus on amenity-rich neighborhoods adjacent to Metro stations within Washington, D.C., including the key growth node of National Landing encompassing Crystal City and Pentagon City [S23]. This strategic portfolio positioning caters effectively to evolving tenant preferences emphasizing transit access combined with lifestyle amenities—factors that bolster lease-up velocity and support rental rate premiums relative to outlying submarkets.
The company’s mixed-use approach integrates multifamily residential units with commercial office spaces and retail offerings, creating synergistic environments that promote placemaking—a concept gaining prominence within urban real estate where community vibrancy enhances asset desirability and valuation metrics.
However, the fully integrated platform must continuously contend with leasing competition from other well-capitalized REITs and private equity players vying for limited assets within these tightly contained submarkets [S23]. Thus, maintaining high occupancy levels and positive rent comps is critical for sustaining revenue streams.
Continuity in Management Fees: A Strategic Revenue Buffer
While asset divestiture pressures top-line rent revenues, JBG SMITH mitigates this cyclicality through its third-party real estate services segment which offers fee-based management solutions including the impact-focused LEO investment platform [S23]. Retaining property management responsibilities after sales generates recurring fee income detached from rent rolls and extends relationships with external investors.
These asset-light revenue streams contribute margin-accretive inflows that cushion EBITDA volatility inherent in the real estate ownership business model.
Moreover, such arrangements facilitate enhanced capital access enabling participation in joint ventures or co-investment opportunities—critical advantages amid constrained financing landscapes.
Consequently, management fee revenues function both as tangible ongoing cash flows and as intangible strategic assets underpinning corporate growth potential beyond traditional leasing operations.
Capital Structure Overview: Managing Debt in a Rising Rate Environment
JBG SMITH’s capital stack includes a revolving credit facility capped at $750 million maturing June 2027—with two six-month extension options—and three tranches of term loans totaling approximately $720 million maturing between January 2026 and June 2028 [S4][S5]. Interest rates on these borrowings range between approximately 4.2% (Tranche A-2 Term Loan) up to nearly 5.9% on revolver balances drawn [S4].
The company employs interest rate swaps fixing SOFR exposures typically around mid-3% to low-4% effective rates through various maturity dates extending into early 2027 [S11]. Such hedging protects against short-term rate spikes but exposes refinancing risk beyond swap horizons.
Existing agreements incorporate restrictive covenants limiting incremental indebtedness, material asset sales without lender consent, and capital expenditure ceilings that impair maneuverability [S4][S5]. These constraints necessitate vigilant liquidity management especially given elevated net leverage metrics common within REIT peers.
In this context, approaching maturities such as the January ’26 tranche will require refinancing or repayment strategies aligned with prevailing credit markets characterized by increased spreads since early-2024.
Analyzing Shareholder Returns: Dividends and Tactical Buybacks
Despite the erosion in net income over recent years, JBG SMITH has persisted in delivering dividends albeit at moderated levels—down from $108 million payments in FY2022 to $48 million by FY2025 [F1]. This continuity spotlights management's commitment to shareholder distributions supported by operating cash flows rather than GAAP earnings alone.
In parallel, the company boosted repurchases substantially during FY2025 with nearly $444 million deployed towards common stock buybacks compared with $171 million in FY2024 [F1][N1]. This pronounced acceleration suggests opportunistic repurchasing occurring amid share price weakness or yield expansion exceeding four percent—a notable threshold surpassed recently [N1].
Such buyback activity serves dual functions: enhancing per-share metrics by reducing float while signaling conviction about intrinsic valuation levels amidst market dislocations.
Maintaining dividends alongside targeted buybacks exemplifies tactical capital allocation balancing return priorities against constrained free cash flow renewal.
Navigating Net Income Losses and Cash Flow Dynamics
A nuanced aspect of JBGS’s financials lies in diverging patterns between accounting net losses and underlying cash flows indicative of operational health [F1]. Net losses exceeding $139 million for FY2025 predominantly reflect non-cash items such as impairments or mark-to-market adjustments common amid volatile appraisal environments rather than recurring economic deficits.
Conversely, positive operating cash flow approximating $73 million post-capital expenditures of ~$35 million yields free cash flow around $38 million—highlighting cash generation sufficient for funding dividend payments albeit reduced versus prior years [F1]. This dynamic underscores why cash-based metrics command primacy among REIT investors evaluating sustainable distributions versus GAAP profitability swings influenced by accounting conventions.
Therefore, while headline earnings remain negative, manageable capex spend alongside reasonable operational inflows provide some cushion supporting near-term liquidity needs.
Outlook on Development Pipeline and Leasing Market Conditions
Looking ahead, JBGS’s growth trajectory hinges critically on its development pipeline execution within primary Metro locations coupled with sustaining leasing momentum across multi-family units and commercial segments [N1][S23]. In markets featuring constrained new supply due to zoning or construction costs paired with steady transit access demand drivers, absorption rates favor upward rent trajectory assuming economic stability.
Nonetheless, competitive pressures persist from other institutional landlords offering flexible terms or newer developments targeting similar tenant demographics noted earlier [S23]. Monitoring lease comparable rents ('lease comp') and absorption trends will thus be pivotal indicators informing JBGS’s ability to regain top-line growth post asset-sale related contractions.
Moreover, tenant concentration risks particularly linked to government leases represent a vulnerability should contract repricing or reductions occur disproportionally impacting revenue streams [S23]. Diversification within tenant mix remains therefore important alongside geographic focus.
Key Risks Impacting Growth and Investment Strategy
Several headwinds temper JBGS’s opportunity set:
- Intense leasing competition across Washington D.C.’s amenity-rich submarkets could suppress rental rate escalation or prolong vacancy cycles despite location advantages.
- Tenant concentration—especially reliance on government entities embedded within commercial leases—introduces counterparty risk sensitive to budget constraints or policy shifts [S23].
- Interest rate hikes elevate borrowing costs directly under variable rate mortgages or upon refinancing maturing term loans exposed after swap maturities; coupled with covenant restrictions reducing borrowing flexibility raise liquidity risk profiles significantly.
- The crowding of capital-intensive private equity firms alongside established REIT peers limits acquisition opportunities at accretive pricing points potentially compressing future portfolio expansion pathways.
Mitigating these risks requires diligent balance sheet stewardship complemented by proactive leasing strategies leveraging JBGS’s localized market expertise.
This report presents an analytical overview of JBG SMITH Properties drawn exclusively from recent audited SEC filings and verified news reports without issuing any investment advice or recommendations.
Disclaimer: This is research-only, informational analysis and not investment advice. It may include AI-generated interpretation and general industry context. Always verify important details using primary sources.
Comments