
JetBlue Airway’s Q1 2026 Operational Pressure Highlights Cost and Demand Balances in a Competitive Landscape
JetBlue's latest quarter reveals rising costs amid strong demand, underscoring strategic expansion and financial challenges.
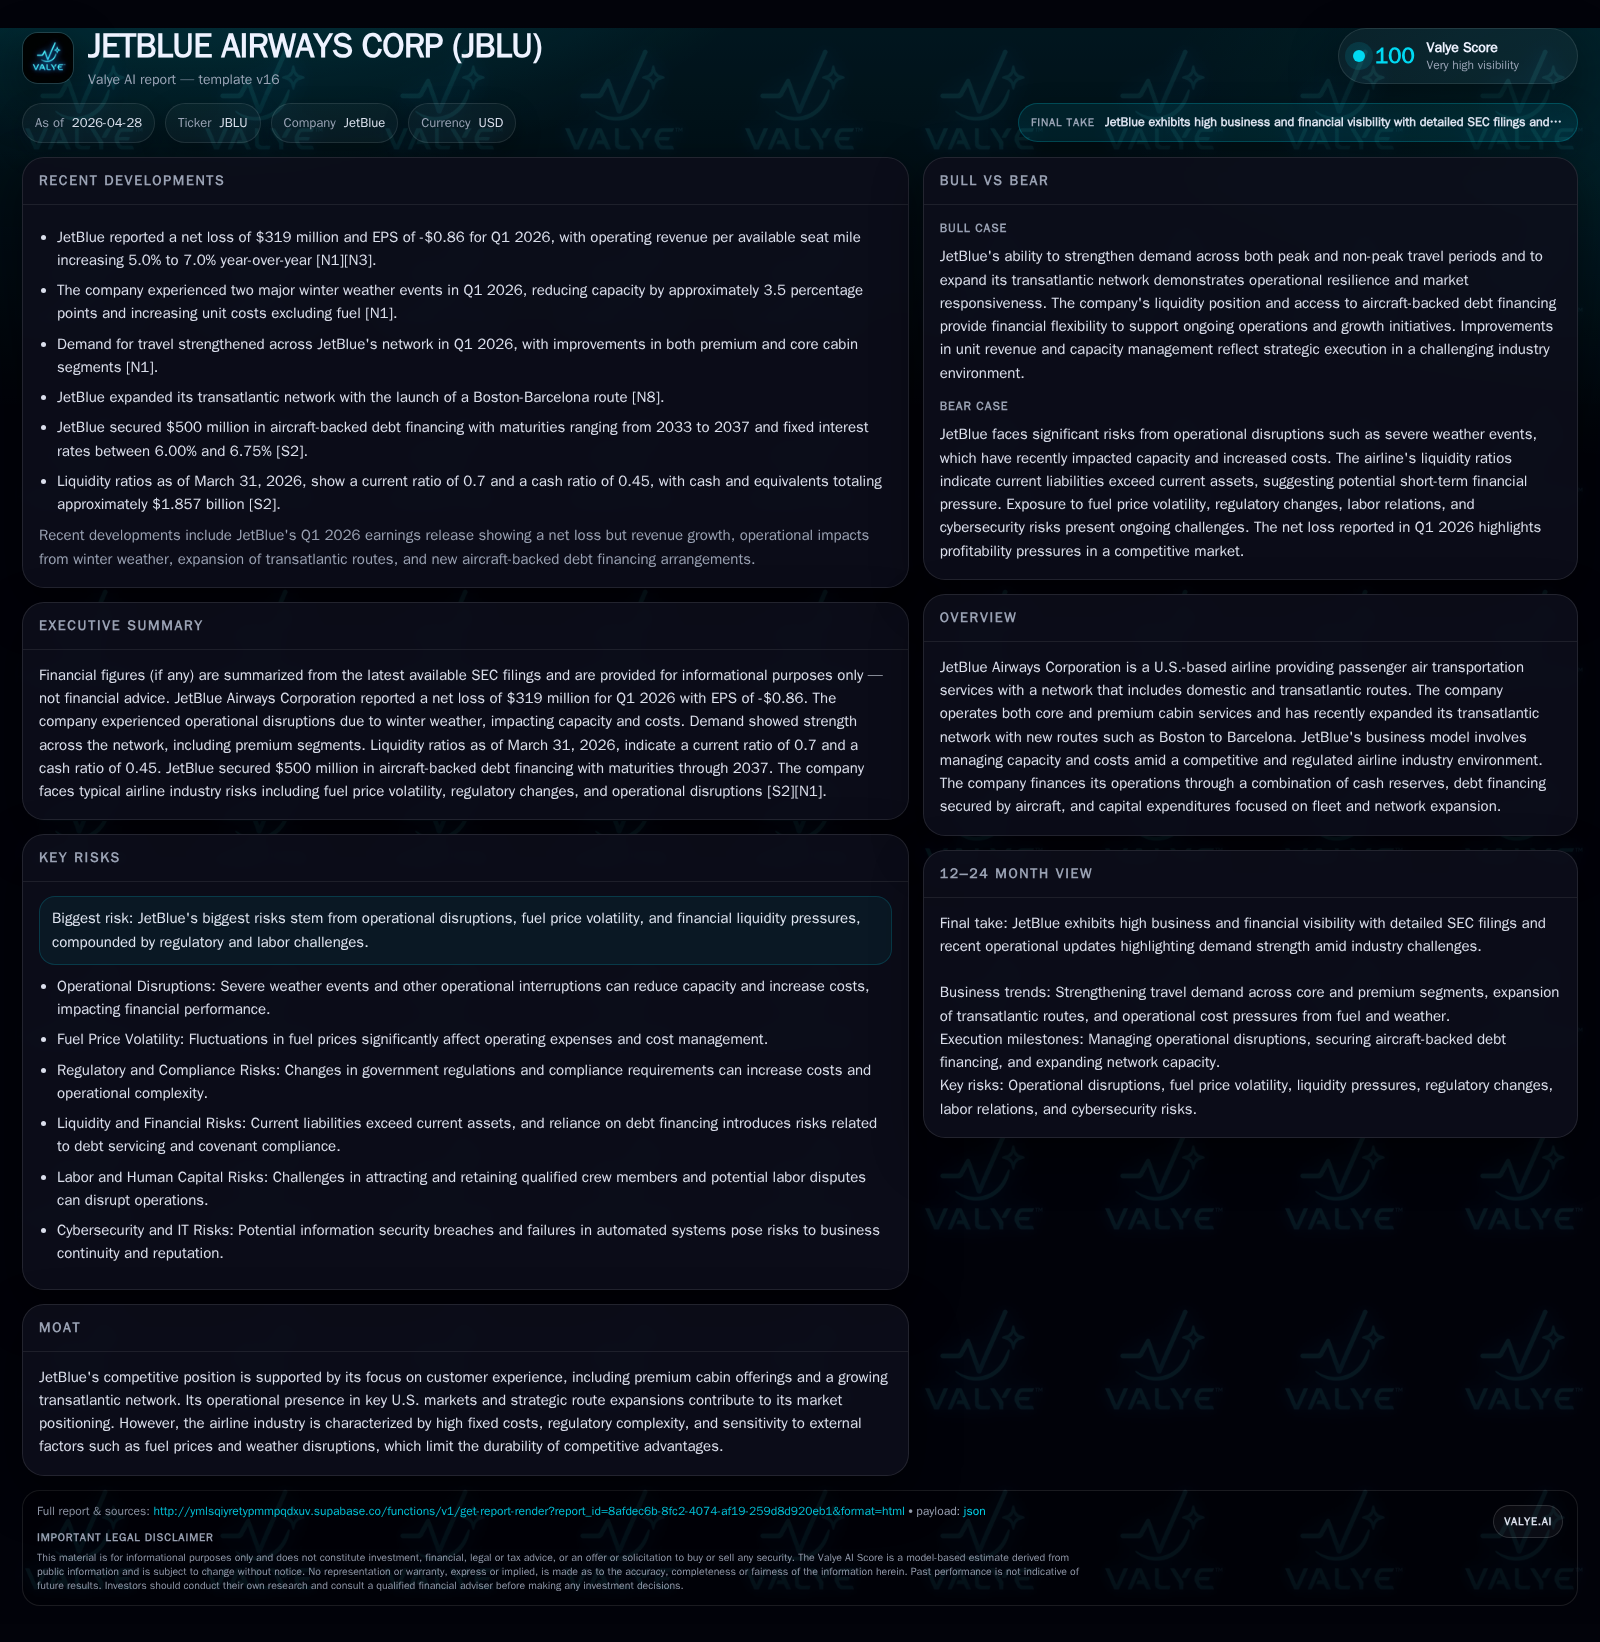
In Q1 2026, JetBlue Airways faced an operational environment marked by weather-related disruptions and rising fuel costs that pressured unit costs despite robust demand growth. The carrier continues to leverage its expanding transatlantic routes and premium cabin offerings to differentiate itself in a highly competitive U.S. airline market. However, capacity reductions affected revenue growth dynamics while financial leverage remains notable with a moderate liquidity cushion. The path forward depends on JetBlue's ability to manage cost inflation, operational reliability, and capital allocation toward fleet and network investments.
Recent Operating Update: Q1 2026 Results and What They Mean
JetBlue Airways' latest quarterly filing (10-Q dated April 28, 2026) reveals an operationally challenging start to the year characterized by significant weather disruptions in January and February. These events led to a roughly 2% year-over-year reduction in available seat miles (ASMs), down from a prior outlook which anticipated growth [S2][S9]. Despite this capacity pullback, the company noted strong travel demand across both core economy and premium cabin segments that partially offset volume declines.
This demand resilience supported an increase in operating revenue per ASM (RASM) by an elevated range of 5-7%, outperforming previous guidance [S2]. However, expense pressures intensified sharply with year-over-year cost per ASM excluding fuel (CASM ex-fuel) rising notably due to operational disruptions and higher maintenance spend from weather impact. Fuel costs themselves also rose substantially during the quarter (averaging ~$3.01-$3.06 per gallon vs. prior $2.27-$2.42 projections), compounding overall cost inflation [S9].
Capital expenditure guidance for the quarter was trimmed slightly to ~$175 million from earlier plans of ~$200 million as part of cautious investment pacing amid broader economic uncertainty [S9]. More importantly, JetBlue announced securing up to $500 million of aircraft-secured debt financing under a Framework Agreement with SKY Leasing affiliates, enhancing liquidity availability for fleet investments [S14]. This financing arrangement carries fixed interest in the mid-6% range with maturities stretching out to the mid-2030s.
Business Model: Revenue Generation Amid Operational Complexity
JetBlue’s business model centers on delivering passenger air transportation services primarily within the United States while expanding selectively into transatlantic markets with premium-class offerings [S1]. Revenue streams derive principally from ticket sales split between core economy passengers seeking value travel options and higher-margin premium customers receiving enhanced service features such as extra legroom seating or lie-flat seats on longer routes.
The company strategically manages capacity through ASMs adjustment to respond flexibly to demand fluctuations influenced by seasonality, macroeconomic conditions, competitive dynamics, and weather patterns evidenced in Q1 results [S9]. Cost controls involve balancing fixed operational infrastructure commitments—crew staffing, airport fees—and variable expenses such as fuel consumption tied directly to network scale.
Notably, JetBlue’s investment in technology-based customer experience innovations like Fly-Fi® inflight internet access aims at increasing brand loyalty and ancillary revenues [S1]. Simultaneously, its fleet modernizations toward more fuel-efficient Airbus A320/A220 family aircraft support cost competitiveness relative to peers.
Industry Structure and Competitive Position: Differentiation in a Tough Environment
Operating within the fiercely competitive U.S. airline market dominated by legacy carriers alongside low-cost competitors, JetBlue stakes differentiation on quality service offerings combined with selective route expansions including transatlantic destinations like Boston-Barcelona unveiled recently [N8][S1]. This blend targets affluent leisure travelers and corporate clients increasingly willing to pay for comfort.
Nevertheless, the airline industry is structurally constrained by high fixed costs—aircraft financing leases or ownership obligations—and subject to volatile input prices such as jet fuel alongside stringent regulatory compliance requirements spanning safety, environmental mandates, and labor relations [S1][S19]. These factors erode pricing power particularly during economic downturns or global shocks.
JetBlue holds strategic hubs primarily in New York metropolitan area airports alongside Boston and Fort Lauderdale which facilitate dense network connectivity but also expose it to local congestion or labor disputes risks [S1]. Its competitive moat centers on customer experience quality but vulnerability remains due to external shocks like severe weather that disrupted Q1 operations.
Growth Drivers: Network Expansion Versus Cost Headwinds
Key growth catalysts include leveraging newly launched transatlantic services that open access to lucrative European leisure & business travel markets supported by robust demand trends noted early this year [N8][S2]. Product mix enhancements with expanded premium cabins contribute upward pressure on RASM.
Capacity management remains a delicate balancing act; the Q1 weather-induced constriction showed how quickly operational realities can disrupt planned growth trajectories [S9]. Managing CASM ex-fuel inflation pressures resulting from crew overtime pay increases after delays plus maintenance spikes is critical for margin improvement.
Liquidity initiatives exemplified by new asset-backed loan facilities provide flexible capital for ongoing fleet modernization expenditures necessary for long-term efficiency gains [S14]. The company's organic growth will hinge on precise execution of network optimization while controlling rising operating expenses.
Growth Constraints: External Risks and Internal Challenges
Operational control vulnerabilities surfaced with storms impacting flight schedules materially impaired utilization rates leading directly to revenue opportunity loss compounded by unexpected maintenance expenses—typical cyclicality intensified due to scale of disruption rather than fundamental demand deterioration [S2][N3].
Fuel price volatility remains another potent constraint; despite hedging programs where applicable, sharp market rises impart unpredictable cost burdens influencing fare pricing strategies adversely.
On regulatory fronts, international route launches carry approvals complexity alongside airport slot allocations that may limit rapid market penetration speed [S1]. Labor relations present ongoing risk given unionization trends affecting crew scheduling flexibility or wage pressures inherent in post-pandemic talent retention battles.
What To Watch Next: Milestones & Indicators
Upcoming quarters will be telling regarding JetBlue’s success in restoring ASMs growth trajectory post-winter storm impacts along with effectiveness at reining operating expenses back toward guided CASM thresholds. Monitoring forward bookings momentum especially on new European routes will signal sustained demand.
Further details about utilization rates of incremental debt under the SKY Leasing Framework Agreements should clarify near-term funding availability for aircraft acquisitions or lease refinancing endeavors [S14]. Additionally, investor updates anticipated later this year may refine full-year outlooks incorporating recent cost inflationary trends [S12].
Lastly, competitive responses from major peers particularly legacy carriers enhancing premium offerings could influence JetBlue’s relative pricing power dynamics.
Financial Profile Summary (Supporting Context)
As of March 31, 2026 end-of-quarter data shows JetBlue maintaining cash & equivalents at approximately $1.86 billion against total debt near $7.7 billion yielding net debt around $5.84 billion; the current ratio sits at roughly 0.7 indicating modest short-term liquidity relative to liabilities [F1].
Disclaimer: This analysis is provided solely for informational purposes based on publicly available filings and news as of April 28, 2026. It does not constitute investment advice or recommendations.
Disclaimer: This is research-only, informational analysis and not investment advice. It may include AI-generated interpretation and general industry context. Always verify important details using primary sources.
Comments