
UNIVEST FINANCIAL Corp Strengthens Profitability Amid Diversified Financial Offerings in Q1 2026
UNIVEST's robust first-quarter earnings reflect strategic asset management and multi-segment revenue diversification underpinning its competitive regional footprint.
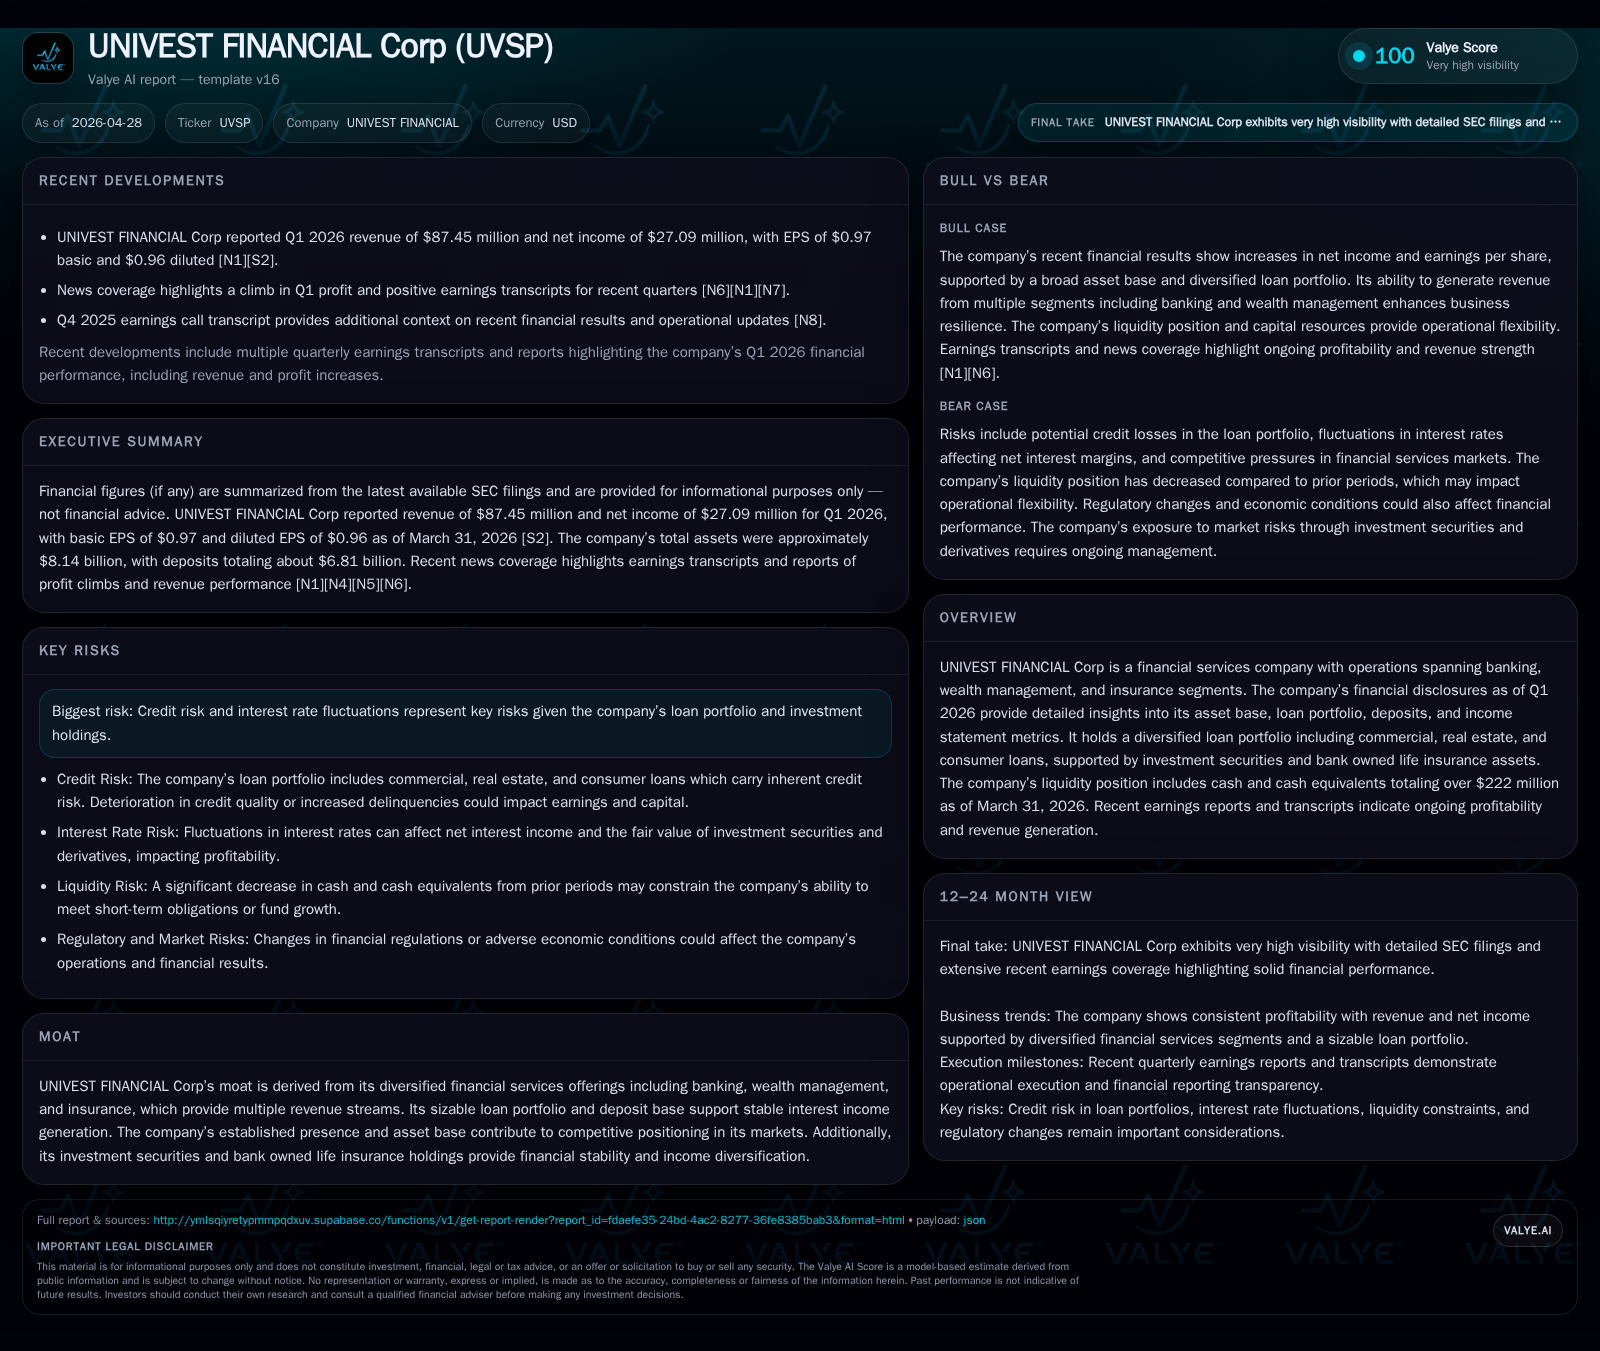
In Q1 2026, UNIVEST FINANCIAL Corp demonstrated notable net income growth driven by disciplined asset-liability management and sustained customer deposit traction. The company’s diversified business model spanning banking, wealth management, and insurance supports stable revenue streams, despite a significant reduction in cash equivalents concurrent with investment portfolio adjustments. Positioned primarily in the Pennsylvania and New Jersey markets, UNIVEST leverages an owned branch network and integrated financial services to maintain customer retention and pricing leverage. Key risks remain concentrated around credit exposure and interest rate volatility, though recent provisions signal improved credit performance. Monitoring loan portfolio composition and margin trends will be critical as the company executes against its growth strategy.
Q1 2026 Operating Summary: Key Developments and Financial Position
UNIVEST FINANCIAL Corp reported a solid start to 2026 with net income climbing to $27.1 million in the first quarter compared to $22.4 million in Q1 2025 [S2]. This marks a meaningful profit improvement underscoring operational stability despite notable shifts in liquidity composition. Total cash and cash equivalents decreased sharply by approximately $331 million from $554 million at December 31, 2025, to $222 million at March 31, 2026 [S2]. This draws attention to a strategic repositioning where cash holdings were deployed into investment securities held-to-maturity which increased slightly to $119.5 million (fair value $106.2 million) during the same period [S2].
The investment portfolio carries marked unrealized losses dominated by long-term residential mortgage-backed securities (RMBS). Such losses mainly arise from rising interest rates affecting bond valuations but are offset through amortization over holding periods given their held-to-maturity classification [S2]. The provision for credit losses decreased substantially to $1.3 million from $2.3 million a year prior indicating moderation of loan impairment concerns and improved credit quality trends within the loan book [S2]. The combination of higher net interest income from optimized asset deployment and reduced credit provisioning drove margin leverage contributing to the quarterly earnings uplift.
UNIVEST's Business Model: Multi-Segment Revenue Streams and Product Quality
UNIVEST operates a multi-pronged financial services model encompassing banking, wealth management, and insurance segments that collectively generate diversified revenue streams providing resilience against localized economic fluctuations [S1]. Its primary revenue driver remains net interest income generated from an asset base comprising diversified loans—commercial financial & agricultural loans, commercial real estate loans, residential real estate loans secured for both business and personal purposes, home equity secured loans, finance leases, and consumer loans [S1][S2]. This broad diversification mitigates concentration risk and smooths income volatility.
Beyond lending, UNIVEST maintains sizable investment securities like RMBS and corporate bonds allowing portfolio yield enhancement while bank owned life insurance assets contribute additional stable noninterest income components protecting overall earnings stability [S1][F1]. Customer-facing wealth management services generate fee-based revenues that benefit from increasing assets under advisement driven by integrated offerings leveraging cross-selling opportunities within its branch footprint [N1][S1]. The insurance segment further supplements earnings via agency commissions creating a one-stop-shop experience favored by customers seeking bundled financial solutions.
The company’s product offerings exhibit strong relevance for its core geographic demographics that rely on reputable regional banks balancing modern digital channels with physical presence advantages underpinning client acquisition and retention dynamics.
Competitive Positioning within Regional Banking and Wealth Management
UNIVEST’s competitive strength derives from its entrenched presence within Pennsylvania and adjacent states (New Jersey and Maryland), operating from an extensive branch network consisting of 52 locations primarily owned rather than leased—enhancing fixed cost control while contributing tangible network value [S1]. Ownership of branches reduces occupancy expenses affording efficiencies versus peers heavily reliant on leased premises.
Strategic integration across banking, wealth management, and insurance services creates significant switching costs by offering holistic financial advisory experiences coupled with lending/deposit products under one roof—a deterrent against client attrition common within fragmented regional banking markets [S1][N1]. Additionally, the regulatory environment confronting mid-sized banks rewards such diversification through multiple compliance thresholds balanced against operational breadth allowing scale advantages.
Digital channel investments complement physical infrastructure allowing UNIVEST to serve customers nationwide online while maintaining local trust relationships benefiting community banking reputations essential in their operating geography.
Growth Catalysts: Demand Drivers, Margin Expansion, and Customer Penetration
Organic momentum is evidenced principally by robust core deposit growth fostering funding cost advantages critical for net interest margin optimization — particularly important in an environment of rising interest rates where deposit repricing lags asset yield changes [N1][S2]. Wealth management inflows continue strengthening fee income streams aligning with demographic tailwinds such as aging populations seeking retirement planning services thereby expanding recurring noninterest revenues offsetting cyclical lending swings.
Loan growth opportunities are prudently pursued focusing on commercial real estate rehabilitation projects driven by local economic recovery trends augmented by diversified lending approaches including residential secured loans for business purposes reflective of entrepreneurial activity within its footprint [N1][S3][S2]. Reduced provisioning requirements signal improving borrower credit profiles underpinning expanded risk appetite without compromising underwriting standards.
Together these factors enhance profitability levers through balanced volume increases alongside price/mix improvements contributing incrementally while maintaining capital discipline.
Risks and Constraints: Credit Exposure, Interest Rate Sensitivities, and Market Dynamics
Credit risk constitutes a primary vulnerability given concentration in residential mortgage-backed securities — particularly those with longer maturities exhibiting sensitivity to interest rate movements impacting fair value metrics with potential implications for earnings volatility under mark-to-market recognition frameworks even if accounting treatment mitigates realized impacts over time [S2][S1]. Commercial lending portfolios retain exposure tied closely to regional economic health wherein any downturn could elevate nonperforming asset levels necessitating increased provisions.
Interest rate fluctuations impose dual pressures related both to asset yield compressions amid funding cost escalation alongside reinvestment risks inherent in maturing securities portfolios demanding judicious duration management strategies aligned with liability profiles to preserve net interest margins consistently amid volatile rate environments.
Regulatory developments continue shaping capital adequacy standards requiring vigilant monitoring though current filings do not indicate any immediate covenant or refinancing risks restricting flexibility or growth execution capacity [S2][F1].
Forward-Looking Considerations: Guidance, Upcoming Milestones, and Execution Metrics
Management commentary suggests ongoing emphasis on balance sheet optimization highlighted by targeted loan portfolio expansion calibrated against market conditions along with enhanced deposit acquisition initiatives sustaining core funding bases supportive of margin stability [N1][S2]. Future milestones include tracking Q2 earnings results focusing on provisioning trends as key indicators of credit cycle inflection points alongside margin trajectory influenced by interest rate policy shifts.
Execution checkpoints encompass successful integration of cross-functional offerings bolstering wealth management client inflows measured through assets under advisement growth rates plus deposit inflow velocity serves as vital demand indicators signaling sustained marketplace acceptance amidst competitive pressures.[N1]
Monitoring shifts in loan mix toward higher-yield segments such as commercial real estate projects aiming at urban redevelopment remain pertinent near-term growth variables coupled with any regulatory adaptations affecting capital consumption norms that might influence strategic planning.
Financial Snapshot: Balance Sheet, Profitability, and Capital Adequacy
At March 31, 2026, liquidity comprised $222 million in cash equivalents down significantly from year-end levels driven by strategic redeployment into investments totaling approximately $119.5 million at amortized cost (fair value lower due to unrealized losses predominantly on long-duration RMBS) illustrating active portfolio risk-return calibration [S2]. The loan book remains broadly diversified spanning commercial financial & agricultural ($293+ million), commercial real estate ($334+ million), residential real estate for business ($232+ million), personal purpose home equity ($97+ million), consumer loans ($65+ million), among others supporting fundamental earning power across multiple sectors simultaneously reducing reliance on any single borrower class [S2].[F1]
Capital adequacy remains sound without reported covenant breaches or material refinancing necessities underscoring financial flexibility necessary for executing growth priorities under conservative leverage parameters consistent with peer regional banks operating under similar regulatory scrutiny [F1][S3].
Disclaimer: This analysis is based solely on publicly filed SEC documents including the company's latest quarterly (10-Q), annual (10-K) filings, recent Form 8-K events, and publicly available earnings transcripts as of April 28th, 2026. It does not constitute investment advice or recommendations but aims to provide an informed industry view grounded strictly on disclosed data.
Disclaimer: This is research-only, informational analysis and not investment advice. It may include AI-generated interpretation and general industry context. Always verify important details using primary sources.
Comments