
Jones Soda Q2 2026: Revenue Growth and Inventory Build Amid Operating Losses
Jones Soda Co. posted strong revenue growth in Q2 2026 but continues to face liquidity challenges due to ongoing operating losses and negative working capital.
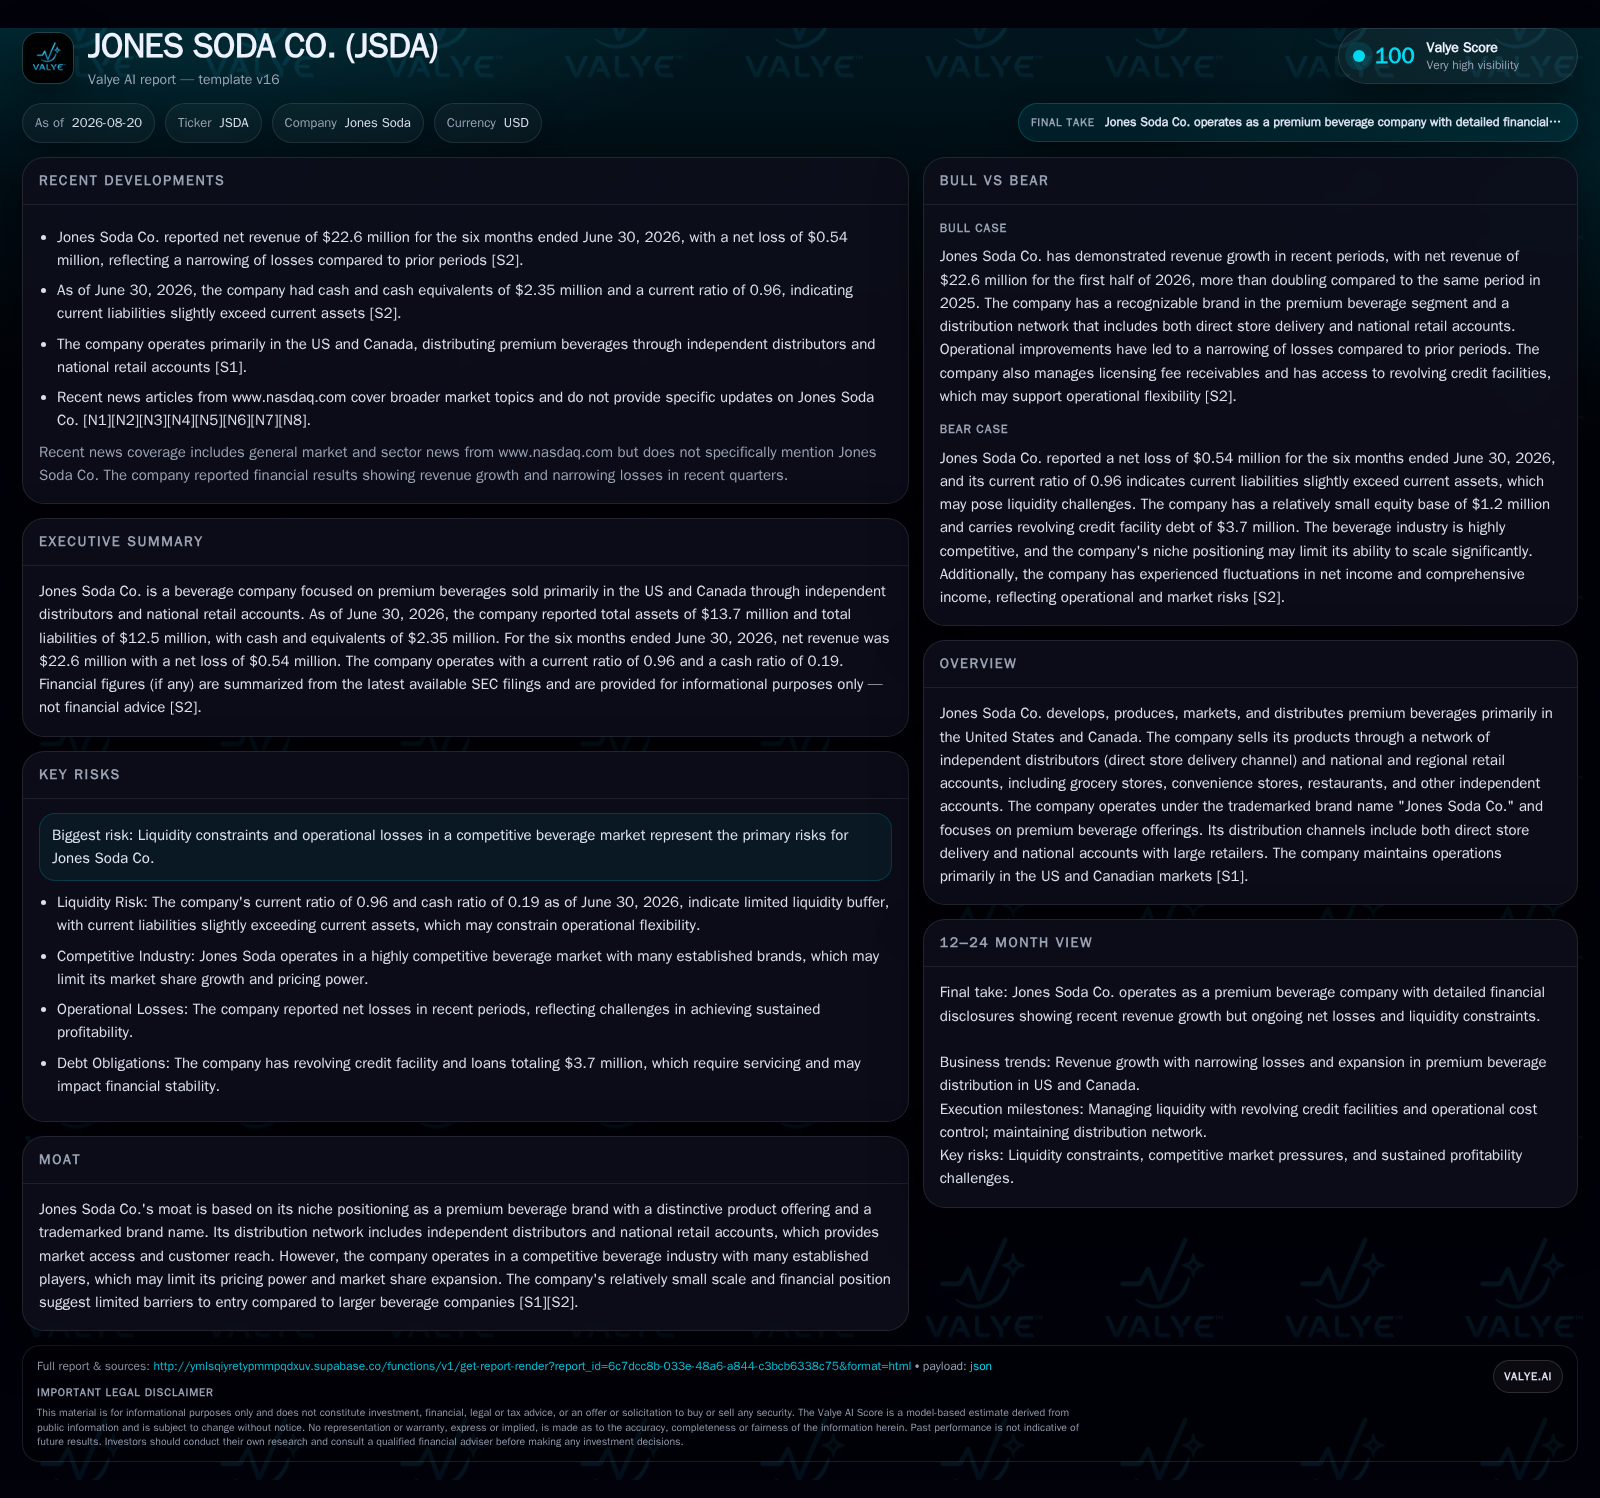
Jones Soda Co. more than doubled its net revenue to $10.168 million in Q2 2026 compared to the prior year quarter, driven by increased sales volume and inventory investment. Despite this growth, the company’s operating loss narrowed only slightly to $0.525 million, and working capital remained negative at approximately $0.5 million as of June 30, 2026. Cash and cash equivalents declined to $2.35 million, reflecting persistent cash burn. Financing activities, including a recent $200,000 private placement and access to a $10 million credit facility with Two Shores Capital Corp, provide some liquidity support but at a high cost. These factors highlight ongoing cash conversion challenges and raise substantial doubt about Jones Soda’s ability to sustain operations without further improvements or financing.
Despite this revenue expansion, the company’s operating loss narrowed only modestly in Q2 2026 compared to Q2 2025, indicating some operational leverage but continued unprofitability [S11]. However, operating expenses also increased, which limited the reduction in operating losses. This dynamic suggests that while Jones Soda is scaling revenue and improving gross margins, it has yet to achieve sufficient operating expense control to reach profitability.
As of June 30, 2026, the company reported a working capital deficiency of approximately $0.5 million, with current liabilities of $12.508 million exceeding current assets of $12.027 million, resulting in a current ratio of 0.96, below the benchmark of 1.0 that typically indicates adequate short-term liquidity [F1][S7]. This negative working capital position highlights ongoing liquidity constraints that could impact the company’s ability to fund day-to-day operations without additional financing.
The cash position declined to $2.351 million at the end of Q2 2026, reflecting continued cash burn despite financing activities [F1][S7]. While non-cash working capital adjustments improved by $2.0 million year-over-year, the company invested heavily in inventories, which increased non-cash working capital by $3.0 million, driven by a $2.0 million inventory increase and a $1.0 million decrease in accounts payable [S7][S10].
Investing activities provided net cash of approximately $1.5 million during the first half of 2026, primarily due to proceeds from the sale of a note receivable, compared to $0.6 million in the prior year [S7][S10]. Financing activities contributed a modest net inflow of $0.1 million, including $0.5 million drawn from the company’s $10 million credit facility with Two Shores Capital Corp, partially offset by repayments on promissory notes and insurance financing obligations [S7][S10].
Jones Soda’s capital structure includes a $10 million credit facility bearing a high interest rate of 13.75% per annum and secured by a first-priority security interest in the company’s assets and its U.S. subsidiaries [S3][S9]. The company also raised $200,000 through a private placement in August 2026, issuing 606,060 units at $0.33 per unit, each consisting of one share of common stock and one-half of a share purchase warrant [S3]. These financing sources provide some operational runway but come at a significant cost and underscore the company’s dependence on external capital to sustain operations.
Jones Soda operates as a niche premium beverage brand selling its products primarily to retailers, distributors, and independent accounts across the United States and Canada [S1]. Revenue is recognized at the point of shipment (FOB shipping point), reflecting the transfer of title and risks to customers [S1][S2][S4]. The company’s margins and cash conversion are influenced by product pricing, cost of goods sold, operating expenses, and working capital management, particularly inventory and payables. The increased inventory levels correspond to efforts to support this demand and scale product availability. However, the persistence of operating losses, negative working capital, and declining cash balances highlight significant cash conversion challenges. These factors raise substantial doubt about Jones Soda’s ability to continue as a going concern without further financing or operational improvements [S2][S7].
From a business economics perspective, Jones Soda’s revenue growth demonstrates improved market traction and product acceptance, which is critical for a small-scale niche player competing in a highly competitive beverage industry. However, the company’s limited scale constrains pricing power and operational leverage, as evidenced by the modest narrowing of operating losses despite doubling revenue. The working capital deficiency and cash burn reflect structural challenges in converting sales growth into sustainable cash flow, exacerbated by the need to build inventory to meet demand and the high cost of external financing. These dynamics underscore the importance of effective working capital management and expense control to achieve profitability and liquidity.
Looking ahead, the bull case for Jones Soda would involve sustained or accelerating revenue growth combined with improved gross margins and controlled operating expenses [S11][S7]. Effective working capital management to convert sales growth into positive cash flow would be critical. Confirmation of this scenario would include positive operating income in future quarters, improved cash flow from operations, and a reduction in the working capital deficit
Conversely, the bear case envisions a stall or reversal in revenue growth, margin compression, rising operating expenses, and an inability to improve liquidity or secure affordable financing [S7][F1][S11]. This would likely result in further cash burn, deteriorating liquidity ratios, and the need for additional dilutive financing or operational downsizing. Observing these trends would raise concerns about the company’s financial sustainability
Key watchpoints for investors and stakeholders include monitoring revenue growth and gross margin trends in upcoming quarters, operating expense control, changes in working capital components such as inventory and payables, cash balance trajectory, and disclosures regarding credit facility terms or new capital raises. These indicators will provide insight into whether Jones Soda can translate its recent sales momentum into sustainable profitability and liquidity.
In summary, Jones Soda’s Q2 2026 results reflect encouraging top-line growth and market demand improvement. However, persistent operating losses, negative working capital, and declining cash balances underscore ongoing liquidity risks. The company’s reliance on costly external financing further complicates its financial profile. The coming quarters will be critical in determining if Jones Soda can overcome these structural challenges and achieve operational sustainability.
Disclaimer: This is research-only, informational analysis and not investment advice. It may include AI-generated interpretation and general industry context. Always verify important details using primary sources.

Comments