
Kirby Corp's Strategic Growth and Capital Dynamics in U.S. Marine Transportation
Kirby Corp leverages its extensive fleet and contract model to sustain growth while navigating capital allocation and market risks.
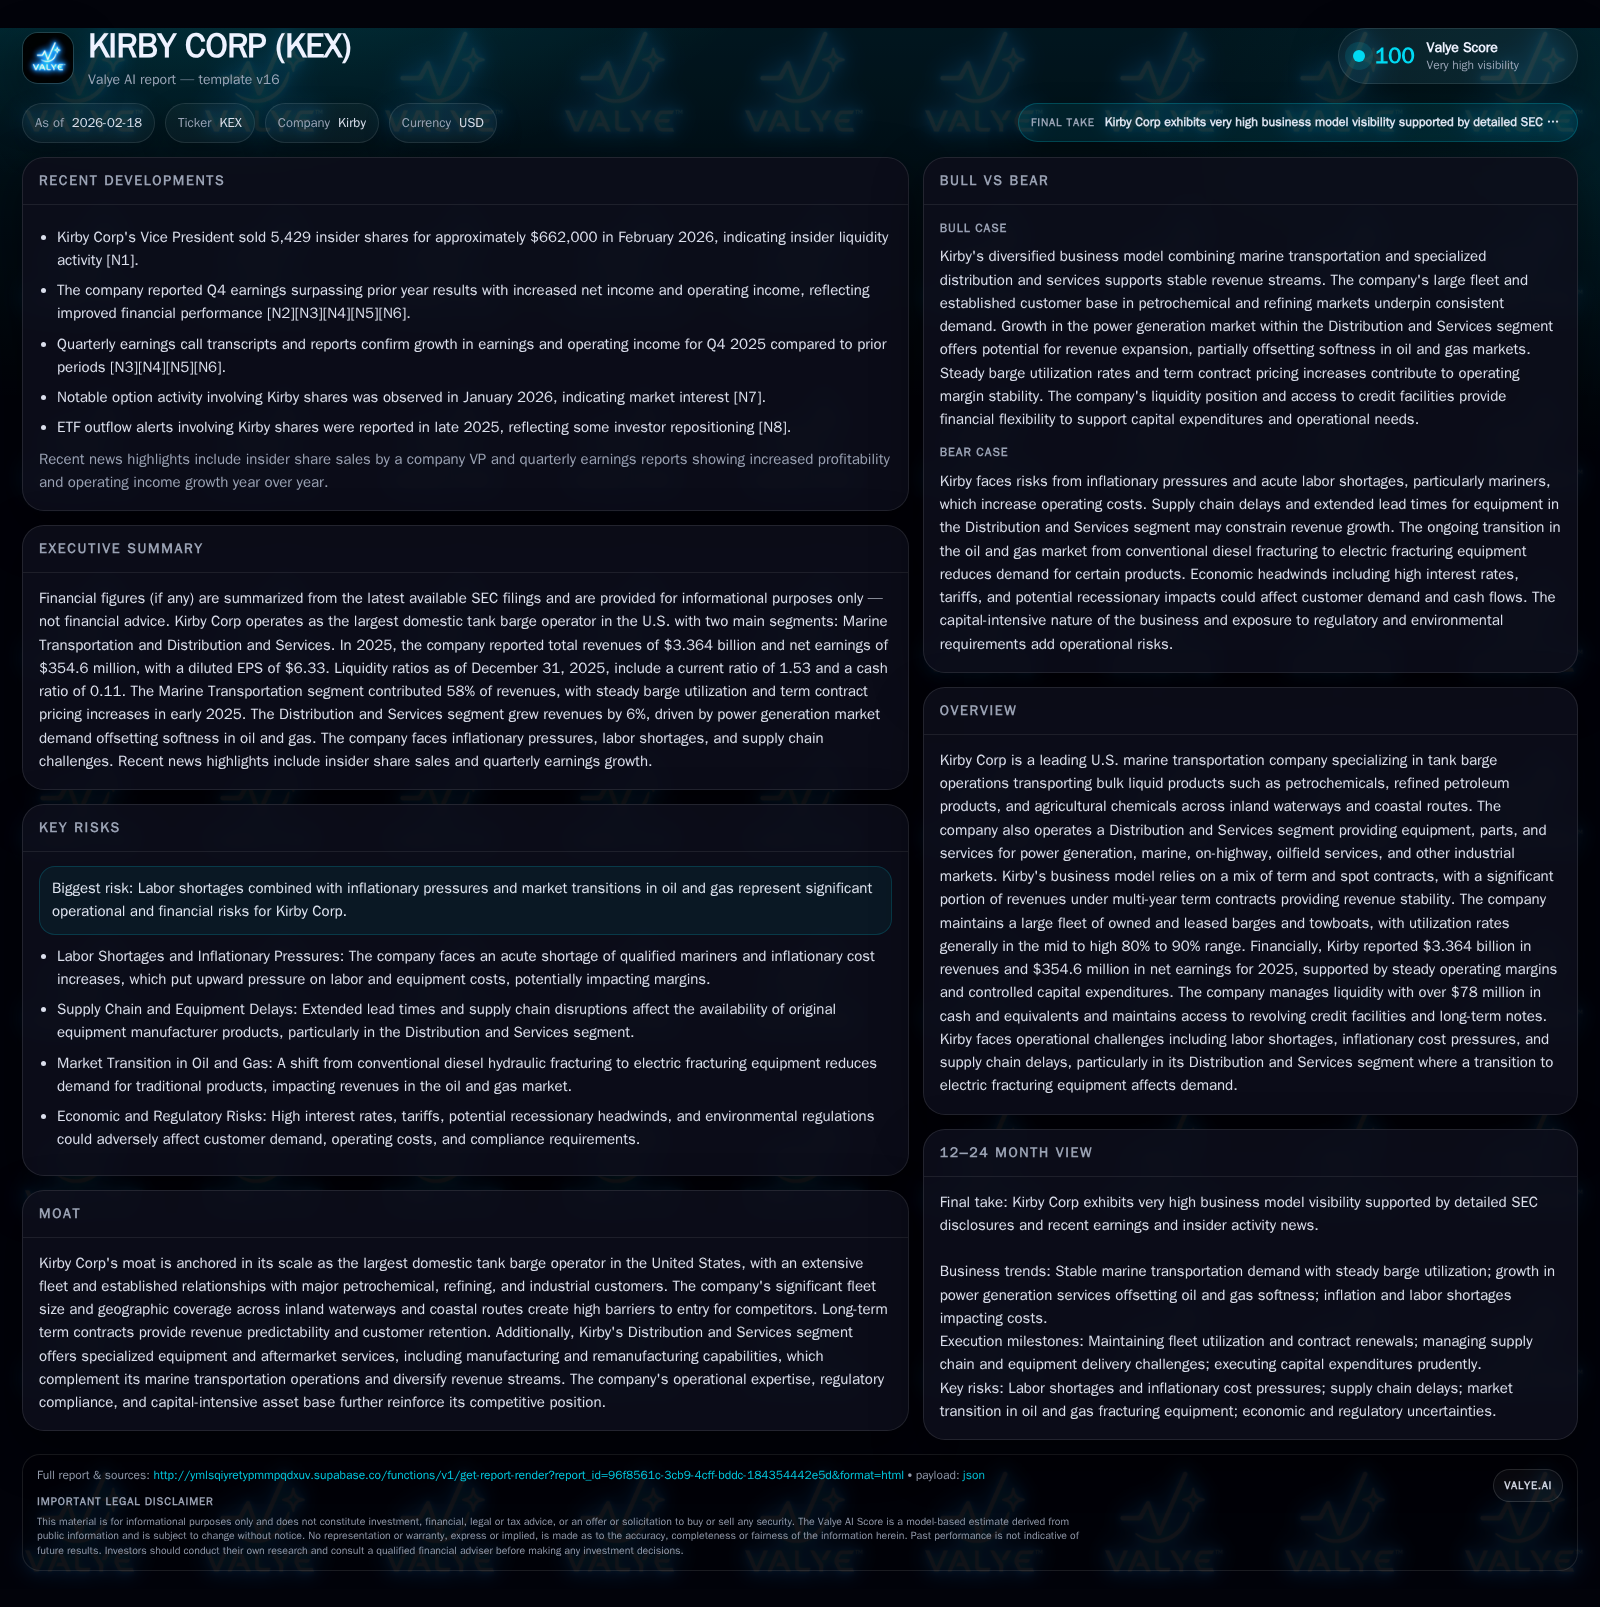
Kirby Corp, the largest U.S. domestic tank barge operator, has demonstrated consistent revenue and earnings growth driven by a blend of term contracts and spot market activities. Its sizable marine fleet and diversified equipment services underpin stable cash flows despite inflationary and labor pressures. The company’s disciplined capital management includes aggressive share repurchases supported by robust free cash flow generation. Going forward, maintaining high utilization rates and managing contract renewals within the evolving petrochemical transport landscape will be critical, while its solid liquidity position affords flexibility amid sector uncertainties.
Kirby’s Historical Growth Trajectory: Revenues, Earnings, and Segment Drivers
Over the last three fiscal years ending December 31, Kirby Corp has shown resilient top-line expansion alongside improving bottom-line metrics despite macroeconomic headwinds. Revenues rose from approximately $3.09 billion in FY2023 to $3.36 billion in FY2025, marking a compound annual growth driven primarily by its marine transportation segment which accounts for the majority of consolidated revenues.[F1][S1]
Net earnings attributable to Kirby advanced at an even more pronounced pace — surging about 23.7% year-over-year to $354.6 million in FY2025.[F1] This outperformance reflects benefit from higher term contract pricing particularly in coastal markets alongside operational efficiencies despite a deliberate reduction in capital expenditures (down ~22.8% YoY) signaling a shift toward maintenance over fleet expansion.[F1] The Distribution & Services segment experienced moderate growth supporting diversified revenue streams.
Historical performance (annual)
| FY | Net ($mm) | CFO ($mm) | OpInc ($mm) | Capex ($mm) | Net YoY |
|---|---|---|---|---|---|
| 2025 | 355 | 670 | 496 | 264 | +23.7% |
| 2024 | 287 | 756 | 399 | 343 | +28.6% |
| 2023 | 223 | 540 | 335 | 402 | +82.3% |
| 2022 | 122 | 294 | 193 | 173 |
Note: Omitted columns lack sufficient annual XBRL coverage in the provided tags (need ≥2 annual points): Rev, Div. Source: SEC companyfacts cache [F1].
Capital returns and efficiency (annual)
| FY | Buybacks ($mm) | FCF ($mm) | ROE% |
|---|---|---|---|
| 2025 | 354 | 406 | 10.5 |
| 2024 | 175 | 414 | 8.6 |
| 2023 | 113 | 138 | 7.0 |
| 2022 | 23 | 122 | 4.0 |
Source: SEC companyfacts cache [F1].
Note: Dividends data not available from provided tags.
Operational Footprint and Contract Structure Underpinning Revenue Stability
Kirby commands the largest U.S.-flagged tank barge fleet specializing in bulk liquids like refined petroleum products, petrochemicals, agricultural chemicals transported via inland river systems (e.g., Mississippi River system) and coastal waters.[S1] Their scale translates to significant vessel ownership/leasing with utilization rates routinely reported in the mid-to-high-80s percent range (targeting ~90%), underscoring strong asset productivity and minimal downtime.[S1][N2]
A key structural strength is Kirby's contract mix combining multi-year term contracts with spot charters; term agreements offer price escalators linked to inflation or producer price indexes helping maintain margins through volatile cost periods—critical given recent inflationary trends.[S20] For instance, inland term contracts saw rate increases of approximately 3–5% excluding fuel effective January 2025.[S20] Term exposure underpins predictability while spot market exposure captures upside during peak demand cycles.
Their Distribution & Services (KDS) business complements transport operations by providing aftermarket parts, rentals, manufacturing/remanufacturing specialized equipment like electric fracturing units—serving growing power generation and oilfield industries—thus diversifying operational risk.[S1]
Recent Financial Performance: Quarterly Results Beat Estimates
Kirby’s Q4 2025 earnings release highlighted net profit growth exceeding analyst expectations driven by higher utilization on coastal barges amid positive customer demand trends,[N1][N2] improved operational controls reducing expense ratios,[N2] and beneficial rate escalators within term contracts that cushioned against some softening spot charters.
The earnings call emphasized normalization of freight volumes post-COVID disruptions and noted that cost containment efforts on fuel consumption alongside labor optimization contributed materially to quarterly margin expansion.[N2]
Capital Allocation and Returns: Share Repurchases, Cash Flow, and ROE Analysis
From a capital management perspective, Kirby exhibited discipline balancing investments with shareholder returns. Operating cash flow declined modestly (-11.4%) to $670 million in FY2025 reflecting timing shifts in working capital,[F1][S19] yet remained robust against capex spend of about $264 million focusing on upkeep of existing marine assets rather than scaling new vessels — a decision aligned with current market conditions.[F1]
This strong free cash flow (~$406 million calculated as CFO minus Capex) fueled aggressive stock buybacks totaling $354 million in FY2025—doubling the prior year’s activity—underscoring management’s confidence in intrinsic value creation potential while no dividends were disclosed.[F1][S16]
Using trailing net income over year-end equity levels yields an approximate ROE of ~10.5%, signifying steady returns relative to the industry’s capital-intensive asset base typical of maritime logistics companies reliant on large fleets and infrastructure investments.[F1]
Emerging Risks: Labor Headwinds, Inflation, and Energy Market Shifts
Kirby openly addresses operational headwinds stemming from labor shortages impacting vessel crewing needs as well as inflation driving higher wage costs—a challenge common across marine operators contending with skilled labor scarcity that can constrain capacity deployment or elevate operating expenses.[S18]
Furthermore, commodity price volatility particularly within oil & gas markets influences freight demand unpredictably; transitional pressures such as reduced diesel fracturing activity shifting toward electric fracturing equipment have led to inventory impairments in KDS segments—affecting short-term profitability and requiring agile inventory management.[S1]
These risks necessitate vigilance on cost controls alongside flexible contract pricing mechanisms that can mitigate margin erosion during cyclical downturns.
Outlook and Growth Prospects: Fleet Utilization, Contract Renewal, and Demand Dynamics
Looking ahead, Kirby aims to sustain utilization rates near historical highs (~90%), subject to navigating ongoing labor tightness and regional economic factors impacting industrial production volumes driving liquid bulk cargo transport demand.[N2][S1]
Contract renewal cadence remains a key variable; long-term agreements typically span multiple years with indexed annual escalators providing incremental revenue uplift though potential renegotiations could introduce volatility especially if energy sector dynamics dampen shipping volumes abruptly.
KDS’s gradual transition towards electric fracturing rigs presents both an innovation challenge and opportunity; although conventional diesel equipment demand wanes,[S1] new product lines aligned with lower emissions could open fresh revenue avenues albeit requiring prudent capital allocation.
Capital spending will likely remain focused on fleet maintenance supplemented by selective growth investments calibrated against macro outlooks.
Financial Flexibility: Debt Profile and Liquidity Positioning
Kirby maintains a sound liquidity position supported by a conservative debt maturity schedule featuring unsecured senior notes totaling approximately $800 million maturing primarily between 2028-2033 alongside a revolving credit facility with nearly $435 million availability as of year-end 2025.
Quarterly principal repayments are minimal until late-term loan maturities approach after mid-decade,[S4][S5] enabling ample runway for strategic funding including acquisitions or opportunistic share repurchases without undue refinancing pressure.
The company remains compliant with all covenants relating to interest coverage and leverage ratios,[S6], preserving financial flexibility vital for responding promptly to market fluctuations or capitalizing on growth opportunities.
Key Milestones to Watch: Contract Developments and Market Responses
Absent explicit forward guidance disclosures,[N#][S#] monitoring Kirby’s quarterly results will be essential to gauge shifts in utilization rates especially for coastal versus inland fleets alongside updates on multi-year contract renewals where any changes can materially affect revenue visibility.
Additionally, progress on KDS segment innovation initiatives including electric fracturing system commercialization may influence future segment profitability mix.
Market responses tied to broader petrochemical supply chain dynamics or regulatory shifts affecting emissions standards could also bear consequential implications for Kirby’s operational strategy.
This analysis is based solely on publicly available information up to early 2026 without any investment recommendations intended.
Disclaimer: This is research-only, informational analysis and not investment advice. It may include AI-generated interpretation and general industry context. Always verify important details using primary sources.
Comments