
Lear Corp Surpasses Q2 Expectations with Restructuring and Operational Momentum
Lear Corporation's Q2 2026 results highlight solid earnings growth and improved cost efficiency amid automotive industry cyclicality.
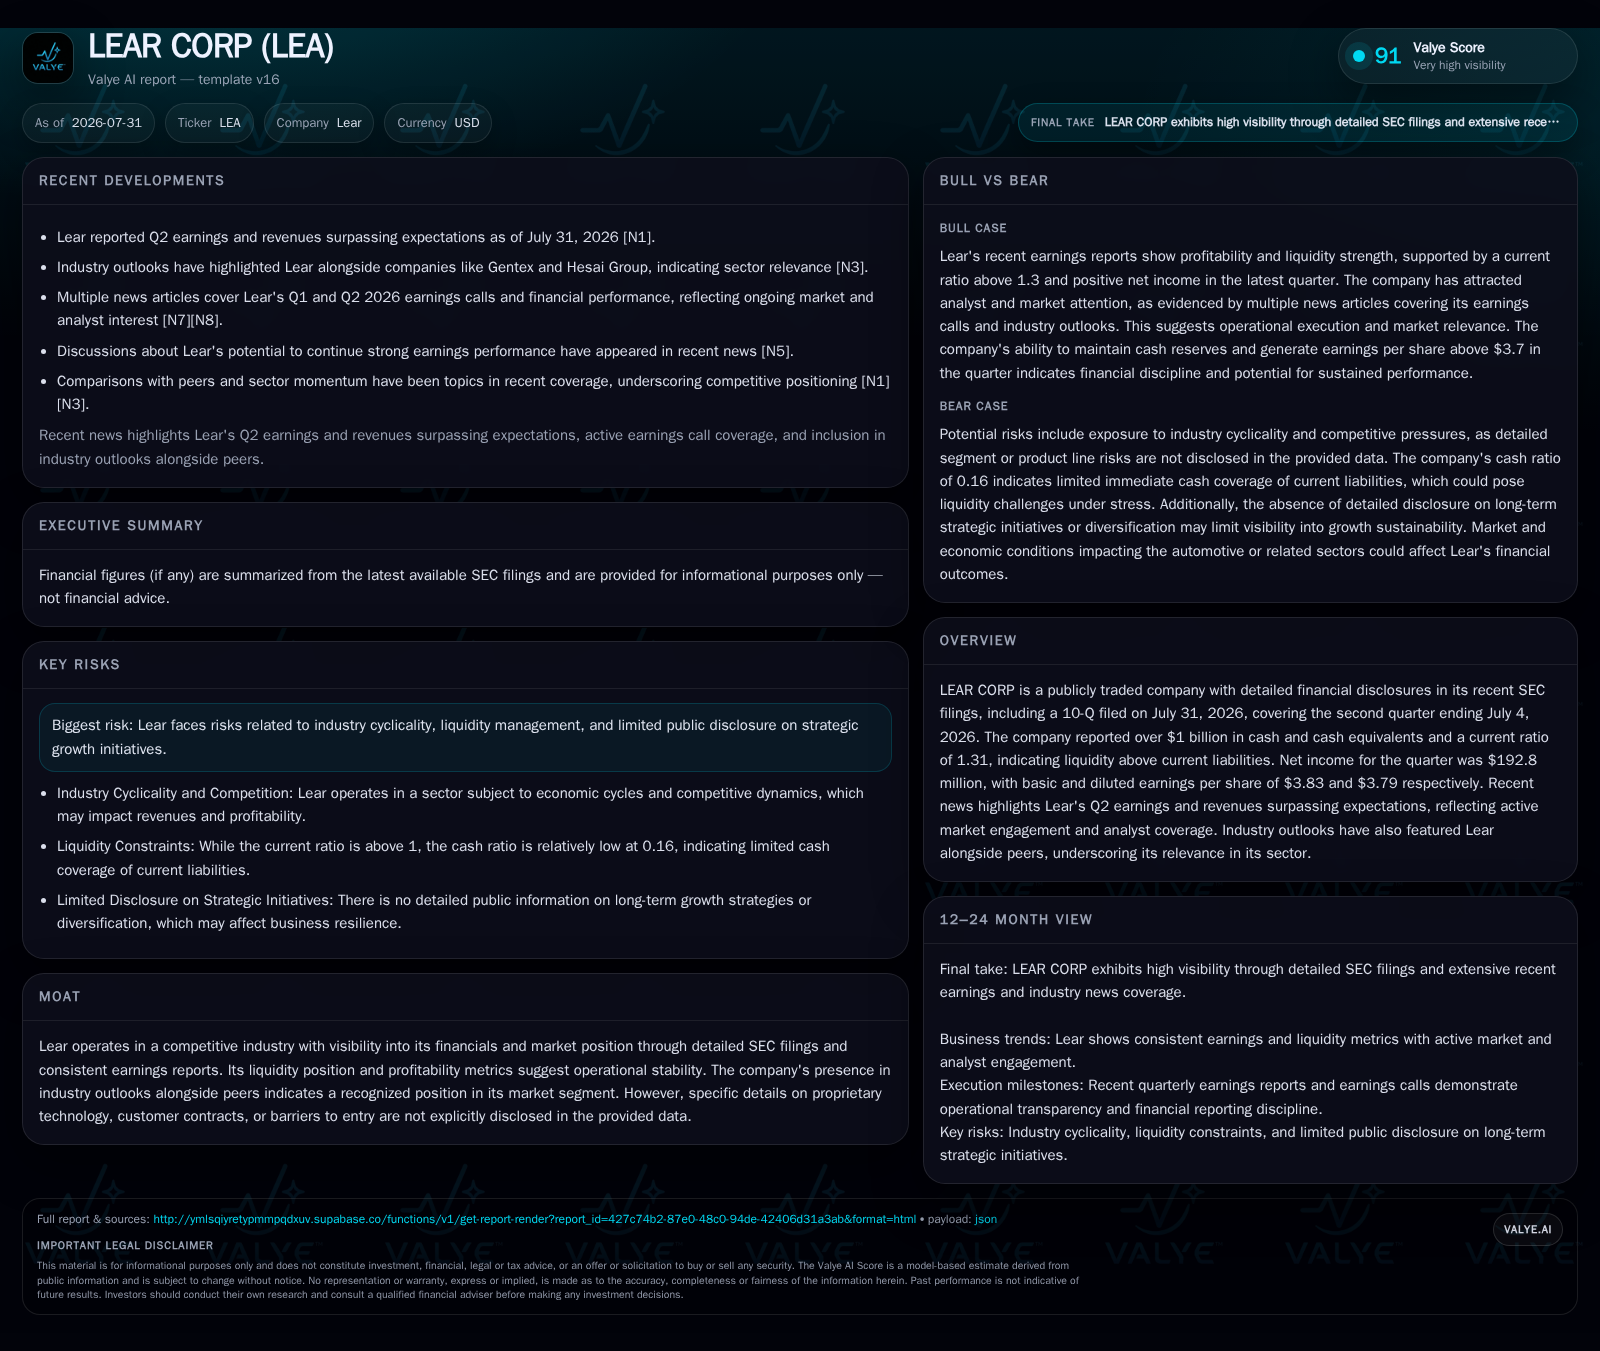
Lear Corp reported net income of $192.8 million for Q2 2026, exceeding analyst estimates alongside a cash balance exceeding $1 billion. The company demonstrated continued operational discipline through a marked reduction in restructuring charges, supporting margin stability despite ongoing supply chain challenges. Lear's dual focus on seating systems and electrical distribution positions it well to benefit from OEM demand trends, especially related to electrification. Covenant compliance and manageable debt maturities underpin financial flexibility as the firm navigates cyclical production volumes and industry uncertainties.
Strong Second Quarter Results Reflect Operational Discipline
Lear Corporation reported a net income of $192.8 million in the second quarter ending July 4, 2026, surpassing analyst expectations with basic and diluted EPS of $3.83 and $3.79 respectively [S2][N1]. This performance underscores operational resilience against the backdrop of cyclical headwinds inherent to the automotive components sector. Relative to prior quarters, Lear's results reveal stabilized demand driven by automotive production volumes that influence booking activity and revenue recognition timing.
A key factor bolstering these results was the notable reduction in restructuring charges. For the six months ended July 4, 2026, restructuring costs decreased to $69 million from $118 million in the prior-year period—a nearly 40% decline indicative of enhanced cost discipline and successful implementation of efficiency initiatives within both Seating and E-Systems segments [S2]. This decline supports a narrative of gradually unlocking operating leverage.
Business Model Strengths: Seating and Electrical Systems Integration
Lear operates as a Tier 1 supplier predominantly engaged in delivering integrated seating systems alongside electrical distribution components including power modules and electronic controllers directly to major automotive OEMs [S1][S4]. These two core segments represent distinct but complementary revenue streams that benefit from long-term contracts, engineering services, and aftermarket sales potential.
The Seating segment supplies complete seat systems that embody significant value-add through integration of mechanical components with sophisticated electrical features such as heating and occupancy sensors. Meanwhile, the E-Systems segment focuses on electrical wiring harnesses, battery disconnect units (BDUs), and low-voltage distribution products crucial for evolving vehicle architectures particularly in electric vehicles (EVs).
Together, these segments underpin diffuse but durable OEM relationships wherein product quality, timely delivery, and engineering support are critical differentiation factors driving repeat business despite competitive pressures [S1]. However, granular details regarding specific contracts or market share are not publicly disclosed.
Automotive Supplier Industry Dynamics Affecting Lear’s Growth Catalysts
The automotive components sector is characterized by inherent cyclicality aligned closely with global automotive production volumes. For Lear, this translates into fluctuating order backlogs and book-to-bill ratios that materially influence short-term top-line visibility [S1][S2]. Book-to-bill below one can foreshadow revenue softness while sustained ratios above one signal strengthening demand.
Pricing dynamics persist under intense scrutiny from OEM customers who exert negotiating leverage that often compresses supplier margins over contract cycles. Additionally, persistent supply chain disruptions affecting raw materials like steel, plastics, and semiconductor content add complexity to cost management efforts.
Capacity utilization constraints—stemming from plant shutdowns or bottlenecks—further temper scaling possibilities in tight market conditions; however, Lear’s global footprint across multiple manufacturing sites helps dilute localized risks [S2]
Restructuring Charges Signal Margin Improvement Pathway
Lear’s strategic streamlining initiatives have led to substantial reductions in restructuring-related expenses compared to previous years. In the first half of 2026, total charges amounted to $69 million down roughly 41% relative to $118 million during the same period in 2025 [S2]
Segment-level data shows Seatings restructuring charges dropping notably from $76 million previously to approximately $47 million currently while E-Systems experienced similar declines from $34 million to about $18 million. These improvements demonstrate focused rationalization steps such as workforce optimization, asset impairments aligned with refreshed product lifecycles, and contract terminations.
Such efficiencies should progressively enhance operating margin prospects as fixed-cost base recalibrations take hold amid normalized production levels—a positive sign relative to peer Tier 1 suppliers which also routinely employ restructuring as an operational leverage tool [S2]
Liquidity Stability Underpinning Financial Flexibility
Financially, Lear maintains ample liquidity buffers supporting operational continuity amid industry cyclicality [S2][F1]. Cash and cash equivalents stood at roughly $1 billion as of July 4, 2026, complemented by current assets totaling approximately $8.39 billion against current liabilities near $6.38 billion—yielding a current ratio of 1.31 [S2][F1].
Debt profile analysis reveals an outstanding unsecured delayed-draw term loan balance of $50 million maturing September 30, 2027 [S2]. The company was in compliance with all covenants related to its credit agreement as of quarter-end reflecting prudent capital management [S2].
Additional long-term debt includes senior notes maturing across multiple years extending into the early 2050s providing staggered refinancing flexibility with no imminent repayment surges. This combination positions Lear with financial agility to manage working capital fluctuations driven by production volume swings.
Growth Drivers: OEM Design Wins & Electrification Trends
The transition toward electric vehicles (EVs) presents a credible structural growth lever for Lear’s Electrical Systems segment which specializes in supplying high-voltage power distribution units like battery disconnect units (BDUs), critical for EV battery safety architectures [S1][N9].
OEM demand for sophisticated electrical connectivity solutions alongside regulatory drivers mandating enhanced vehicle safety features propels innovation investments potentially accelerating design wins for Lear in future vehicle platforms.
Coupled with ongoing R&D expenditures aimed at lightweight seating solutions improving fuel efficiency (or enhancing EV range), these trends underscore structural opportunities amid proximate cyclicality challenges inherent in vehicle production expansion or contraction cycles.
Risks: Cyclicality, Customer Concentration, Supply Chain Pressures
Lear's fortunes remain materially tied to the cyclical nature of global automotive production which can cause periods of volatility in order flow thereby impacting revenue predictability [S1]. Customer concentration risk also persists since a handful of major automotive OEMs account for substantial portions of total sales exposing Lear to shifts in procurement strategies or model portfolio adjustments.
Supply chain disruptions—whether due to geopolitical events, raw material shortages or logistics bottlenecks—pose ongoing threats elevating input costs or causing temporary output constraints which may compress margins if not fully offset by pricing adjustments [S2]
OEM negotiations continually pressure pricing structures challenging sustained margin expansion absent offsetting efficiency gains or product mix improvements. Other risks include potential labor relations issues given unionized plants prevalent within some manufacturing hubs.
What Investors Should Watch Next: Backlog Trends and Margin Trajectory
Attention should center on forthcoming quarterly disclosures regarding order backlog evolution as this metric directly reflects demand momentum translating into future revenue streams [S2][S3]. A rising book-to-bill ratio would suggest healthy order inflows complementing margin improvement pathways initiated through restructuring efforts.
Furthermore, monitoring new design wins particularly tied to EV programs or innovative seating technologies could indicate expanding OEM content penetration fostering medium-term growth sustainability.
Operating margin trajectories will serve as critical confirmation points validating whether restructuring-related savings sufficiently compensate for inflationary cost pressures and mix shifts inherent within evolving vehicle platforms.
Financial Profile Discussion: Leverage and Liquidity Analysis
Though Lear carries a considerable gross debt load near $2.75 billion as per latest companyfacts data (with net debt around $1.75 billion when factoring cash balances), liquidity adequacy is underscored by over $1 billion cash plus highly liquid current assets maintaining favorable coverage metrics including a current ratio at 1.31 [F1][S2]
Covenant compliance on the credit facility affirms access continuity to unsecured capital markets while limited near-term maturities—a mere $50 million unsecured term loan due late 2027—mitigate refinancing risk pressure for now [S2]
Capital expenditures remain focused on maintaining capacity aligned with client needs though no material spike is currently noted; share repurchases exercise moderate scale preserving financial flexibility per periodic disclosures [S13].[N1]
Overall balance sheet stability provides a solid platform supporting operational investments while weathering industry cyclical fluctuations inherent to automotive Tier 1 suppliers like Magna International or Adient plc.
This analysis is based solely on publicly available SEC filings dated through July 31, 2026 ([S1], [S2], [S3]) and supporting news sources ([N1], [N9]). It does not constitute investment advice but rather aims to provide an informed framework for understanding Lear Corporation's recent performance within its industry context.
Disclaimer: This is research-only, informational analysis and not investment advice. It may include AI-generated interpretation and general industry context. Always verify important details using primary sources.

Comments