
Lionsgate Studios Navigates Content Volatility with Strategic Financing Moves
Lionsgate’s recent quarter highlights operational cash use and refinancing activity amid a challenging content-driven revenue environment.
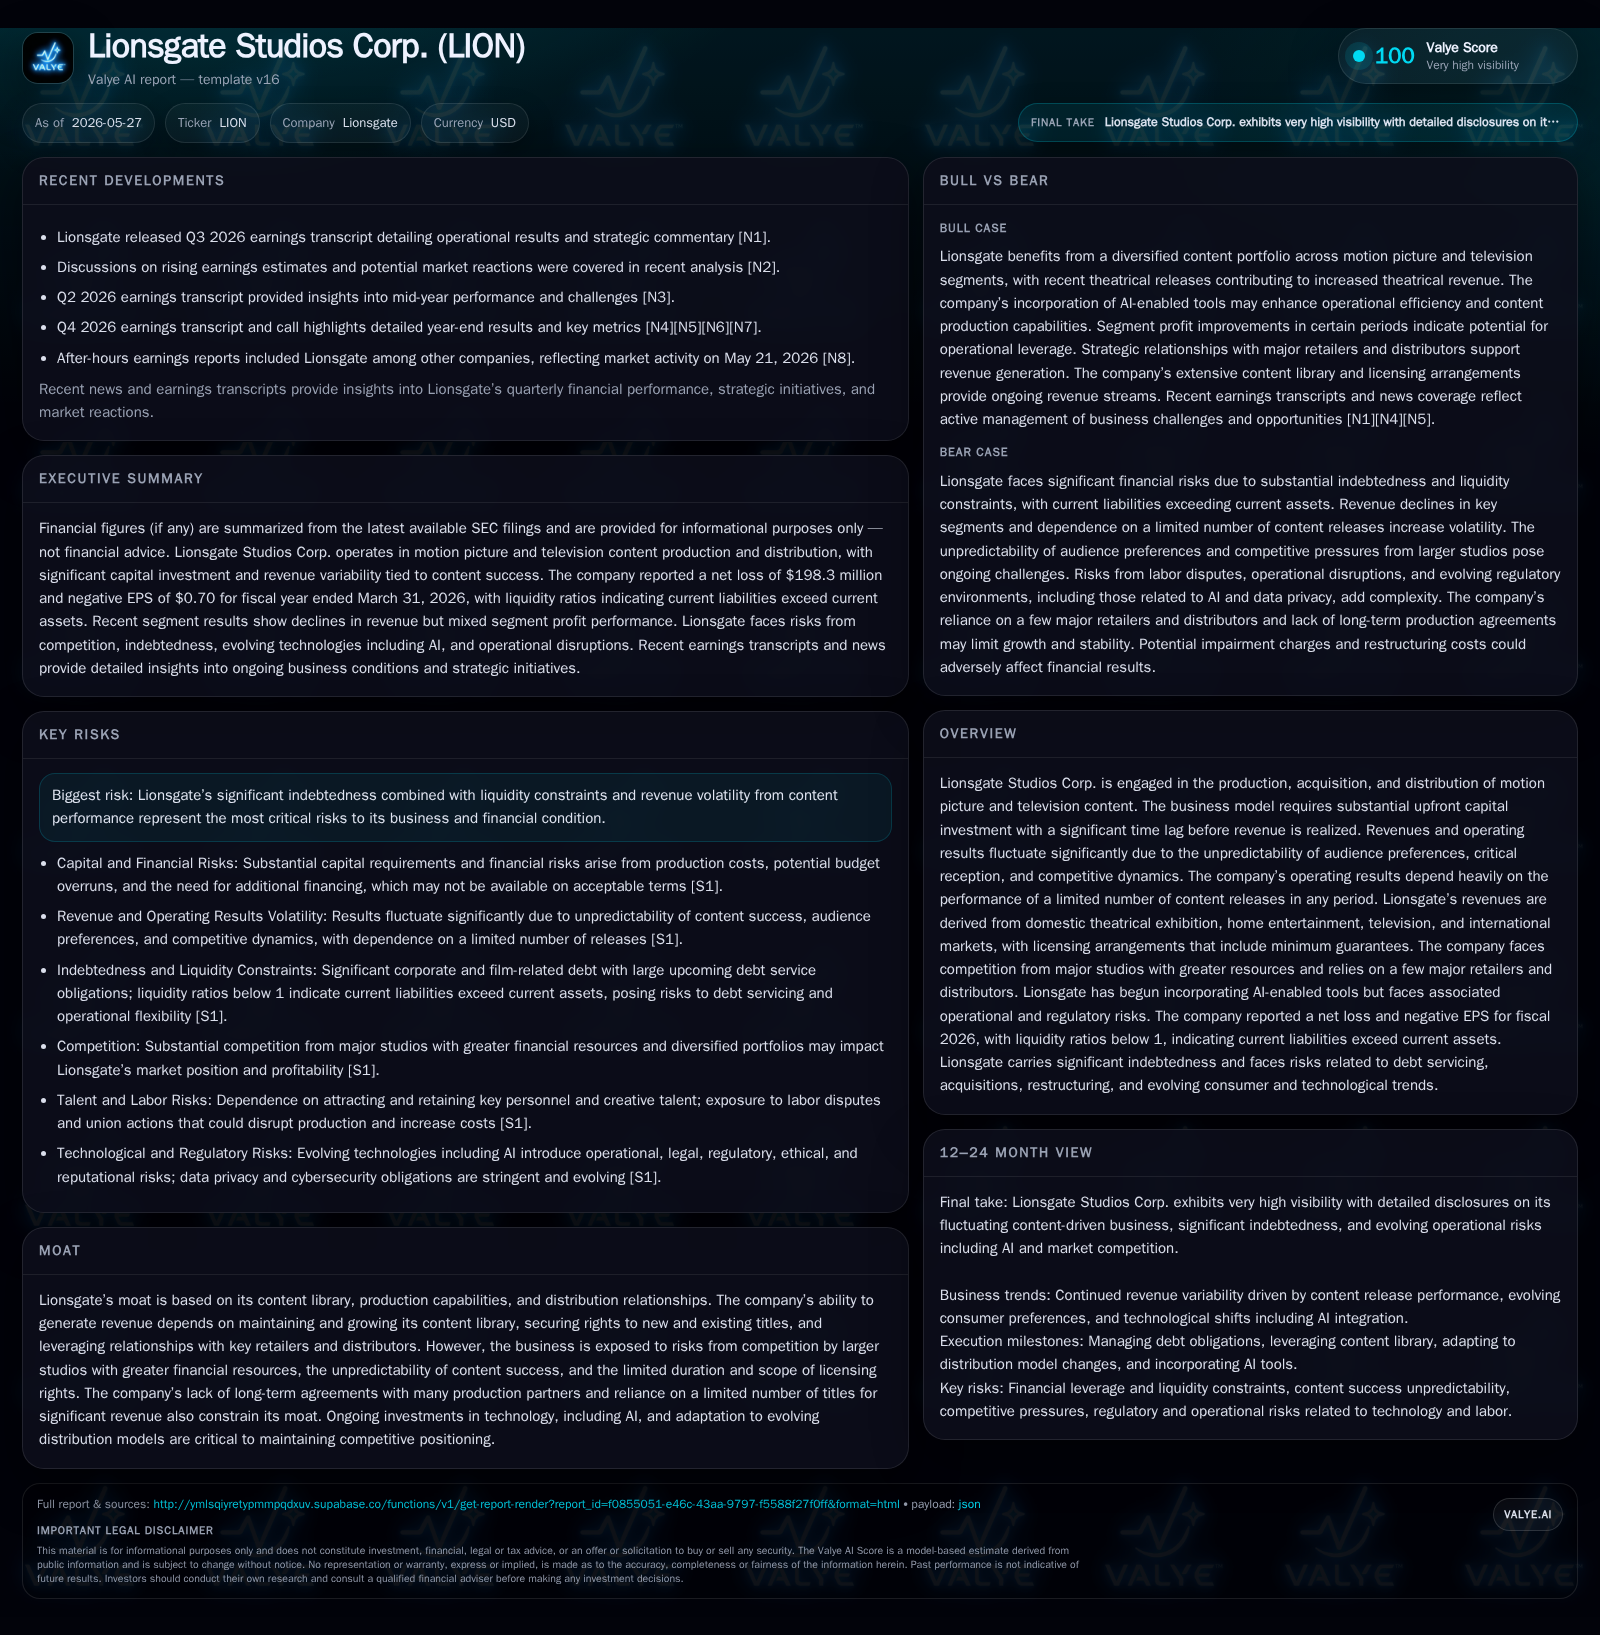
In its latest quarter ending December 31, 2025, Lionsgate Studios saw a moderate decline in cash balances primarily driven by content production and marketing expenses alongside strategic refinancing linked to its Starz separation. The company’s model hinges on high upfront capital investment and volatile revenue streams tied to a small number of content hits, making financial management critical. Increasing indebtedness and liquidity constraints underline the need for effective cash allocation and risk mitigation as it competes against studios with deeper pockets and evolving distribution platforms. Future growth depends on expanding its content library, leveraging technology like AI, and managing rights and partnerships effectively.
Latest Quarterly Operating Update: Cash Flow and Refinancing Developments
In the third quarter ending December 31, 2025, Lionsgate experienced a $45.9 million decrease in cash and equivalents before foreign exchange impacts [S2]. This outflow predominantly reflects ongoing cash use in film and television productions, acquisitions of film rights, distribution and marketing activities alongside general administrative expenses—core operational uses that underscore the capital-intensive nature of Lionsgate's business [S2]. Debt movements reveal that while conventional borrowings netted a slight repayment of $64.7 million over nine months, film-related obligations saw net borrowings increase by approximately $51.3 million during the same interval [S2]. Notably impactful was a $262.8 million cash settlement associated with Starz Separation refinancing completed within the period [S2], representing a significant one-time liquidity event.
This combination of routine operating cash usage paired with refinancing costs highlights Lionsgate’s balancing act between funding content pipelines—which require large upfront investments—and managing capital structure pressures amid unpredictable revenue inflows.
Business Model Overview: Content Production, Licensing, and Revenue Mix
Lionsgate operates primarily through the production, acquisition, and distribution of motion picture and television content [S1]. The company's revenue is derived from multiple channels including domestic theatrical releases, home entertainment sales (physical/digital), television licensing fees, and international distribution rights [S1]. Each of these avenues is influenced by a constellation of factors: timing of releases across windows (theatrical to digital), geographic distribution nuances, genre mix, talent appeal, critical reception, and changing consumer behavior.
Key to Lionsgate’s economic architecture is the substantial upfront capital required to produce or acquire content well before revenues start flowing. This leads to inherent timing lags creating uneven quarterly earnings patterns susceptible to hit-driven fluctuations. While certain licensing agreements include minimum guarantees that partially mitigate risk case on titles’ commercial performance, these protections are not absolute given the ephemeral nature of media rights [S1].
Revenue concentration around a handful of high-profile projects per period intensifies operating leverage; poor showings can cause significant swings in results. This factor requires vigilant portfolio management and continuous replenishment of valuable IP assets.
Industry Structure and Competition: Peers, Distribution Channels, and Pricing Power
Within the competitive landscape populated by major studios such as Warner Bros., Universal, Disney, and Paramount, Lionsgate holds differentiated positions primarily through its branded content library and agile production model [S1]. However, it faces formidable competition from these better-capitalized players who wield extensive global distribution networks and deeper financial resources.
Distribution channels remain crucial bottlenecks; Lionsgate depends on a limited number of major retailers and exhibitors controlling theatrical releases as well as key broadcasters/licensors for television revenues [S1]. These relationships constrain pricing leverage especially as new digital-first platforms alter traditional windows through accelerated streaming releases or ad-supported models (FAST). Coordinating release timing across multiple territories involves managing regulatory restrictions and cultural preferences—a complex scheduling challenge affecting revenue realization.
Technological advances—including AI-enabled tools—are being incorporated to optimize aspects ranging from script analysis to marketing targeting [S1]. Yet accelerating adoption by competitors could erode relative advantages if Lionsgate does not scale usage effectively.
Growth Drivers: Content Library Expansion, Technology Adoption, and Market Penetration
Lionsgate’s pathway to growth centers on strategically enlarging its proprietary content portfolio which serves as an appreciating asset base generating licensing income over extended periods when managed adeptly [S1]. Ownership or exclusive distribution rights allow tailoring release strategies spanning theatrical exhibition through multiple downstream windows.
The integration of artificial intelligence tools into production workflows holds potential efficiency gains—reducing time-to-market and optimizing creative decisions—thus lowering capital intensity per project [S1]. International expansion remains vital; emerging markets offer growing demand for diverse entertainment formats but require robust local partnerships.
Licensing strategies are refined continuously in response to rapidly evolving consumer consumption habits—a function increasingly influenced by subscription streaming versus transactional models. Success metrics include title-level viewership data trends, licensing agreement renewals at sustainable rates, capacity utilization in production stages, and backlog replenishment with greenlit projects—all essential KPIs underpinning growth forecasts.
Risks and Constraints: Revenue Volatility, Capital Requirements, and Leverage
The company’s high fixed-cost base driven by expensive upfront investments exposes it fundamentally to hit-or-miss revenue volatility [S1][S15]. Unfavorable audience reception or shifts in competitive output can trigger impaired recoveries leading to write-offs materially impacting income statements [S18]. Budget overruns or production delays can worsen margin pressures while introducing financing challenges.
Financially constrained by sizable outstanding indebtedness—total corporate debt approximated $1.98 billion as of March 31, 2026—with net debt near $1.64 billion after factoring cash reserves suggest limited cushion against unforeseen operational shocks [F1][S2]. The current ratio under 0.5 reveals marked liquidity tightness restricting flexibility in managing working capital needs or seizing emergent opportunities [F1].
The debt profile carries exposure to variable interest rates impacting interest cost volatility amid fluctuating macroeconomic conditions [S14]. Covenants embedded in debt agreements impose operating constraints potentially limiting actions including asset dispositions or additional borrowing [S17].
Furthermore, reliance on a concentrated slate of titles heightens risk concentration affecting forward earnings visibility while regulatory developments around AI usage or content-related liabilities add complexity risks [S21][S16]
What to Watch Next: Content Pipeline, Financial Guidance, and Partnership Developments
Market attention should focus on forthcoming quarterly earnings announcements providing updates on box office performance vis-à-vis released titles plus indicators around television program renewals or cancellations—key demand markers revealing consumer acceptance trends [N1][N4]. Progress on refinancing initiatives or improved cash flow dynamics would reflect attempts to ease financing strain noted previously.
Announcements regarding strategic alliances or expanded licensing arrangements could offer renewed avenues for scaling revenues especially within international markets where distribution reach may be fragmented. The evolution of monetization models embracing ad-supported streaming (FAST) or hybrid subscription frameworks likewise merits observation given its ramifications for long-term pricing power.
Technology adoption milestones including rollout scale of AI-driven tools tied explicitly to cost savings or time reductions would provide insight into operational modernization progress potentially differentiating Lionsgate competitively.
Financial Profile: Current Liquidity and Leverage Context
As of March 31, 2026 Lionsgate reported cash and equivalents totaling approximately $342 million set against total corporate debt of roughly $1.98 billion resulting in net debt around $1.64 billion [F1][S2]. Current assets stood at about $1.49 billion contrasted by current liabilities near $3.05 billion yielding a current ratio near 0.49 highlighting pronounced short-term liquidity pressure [F1].
Operating income for the period remained positive at approximately $97 million whereas the net loss registered a significant deficit near $198 million indicating considerable non-operating charges such as impairments or restructuring included within results [F1][S2]
This financial posture underscores an imperative focus on judicious capital allocation alongside ongoing efforts to optimize expense structures amid inherently volatile revenue streams driven by hit-dependent content economics.
This analysis synthesizes publicly available filings up to May 27, 2026 without offering investment research views. Readers should evaluate company fundamentals within broader industry trends acknowledging inherent uncertainties tied to entertainment market dynamics.
Disclaimer: This is research-only, informational analysis and not investment advice. It may include AI-generated interpretation and general industry context. Always verify important details using primary sources.

Comments