
Louisiana-Pacific’s Financial Strain and Dividend Resilience Amid OSB Market Downturn
LPX faces earnings pressure from falling OSB prices and volumes while maintaining steady dividend increases.
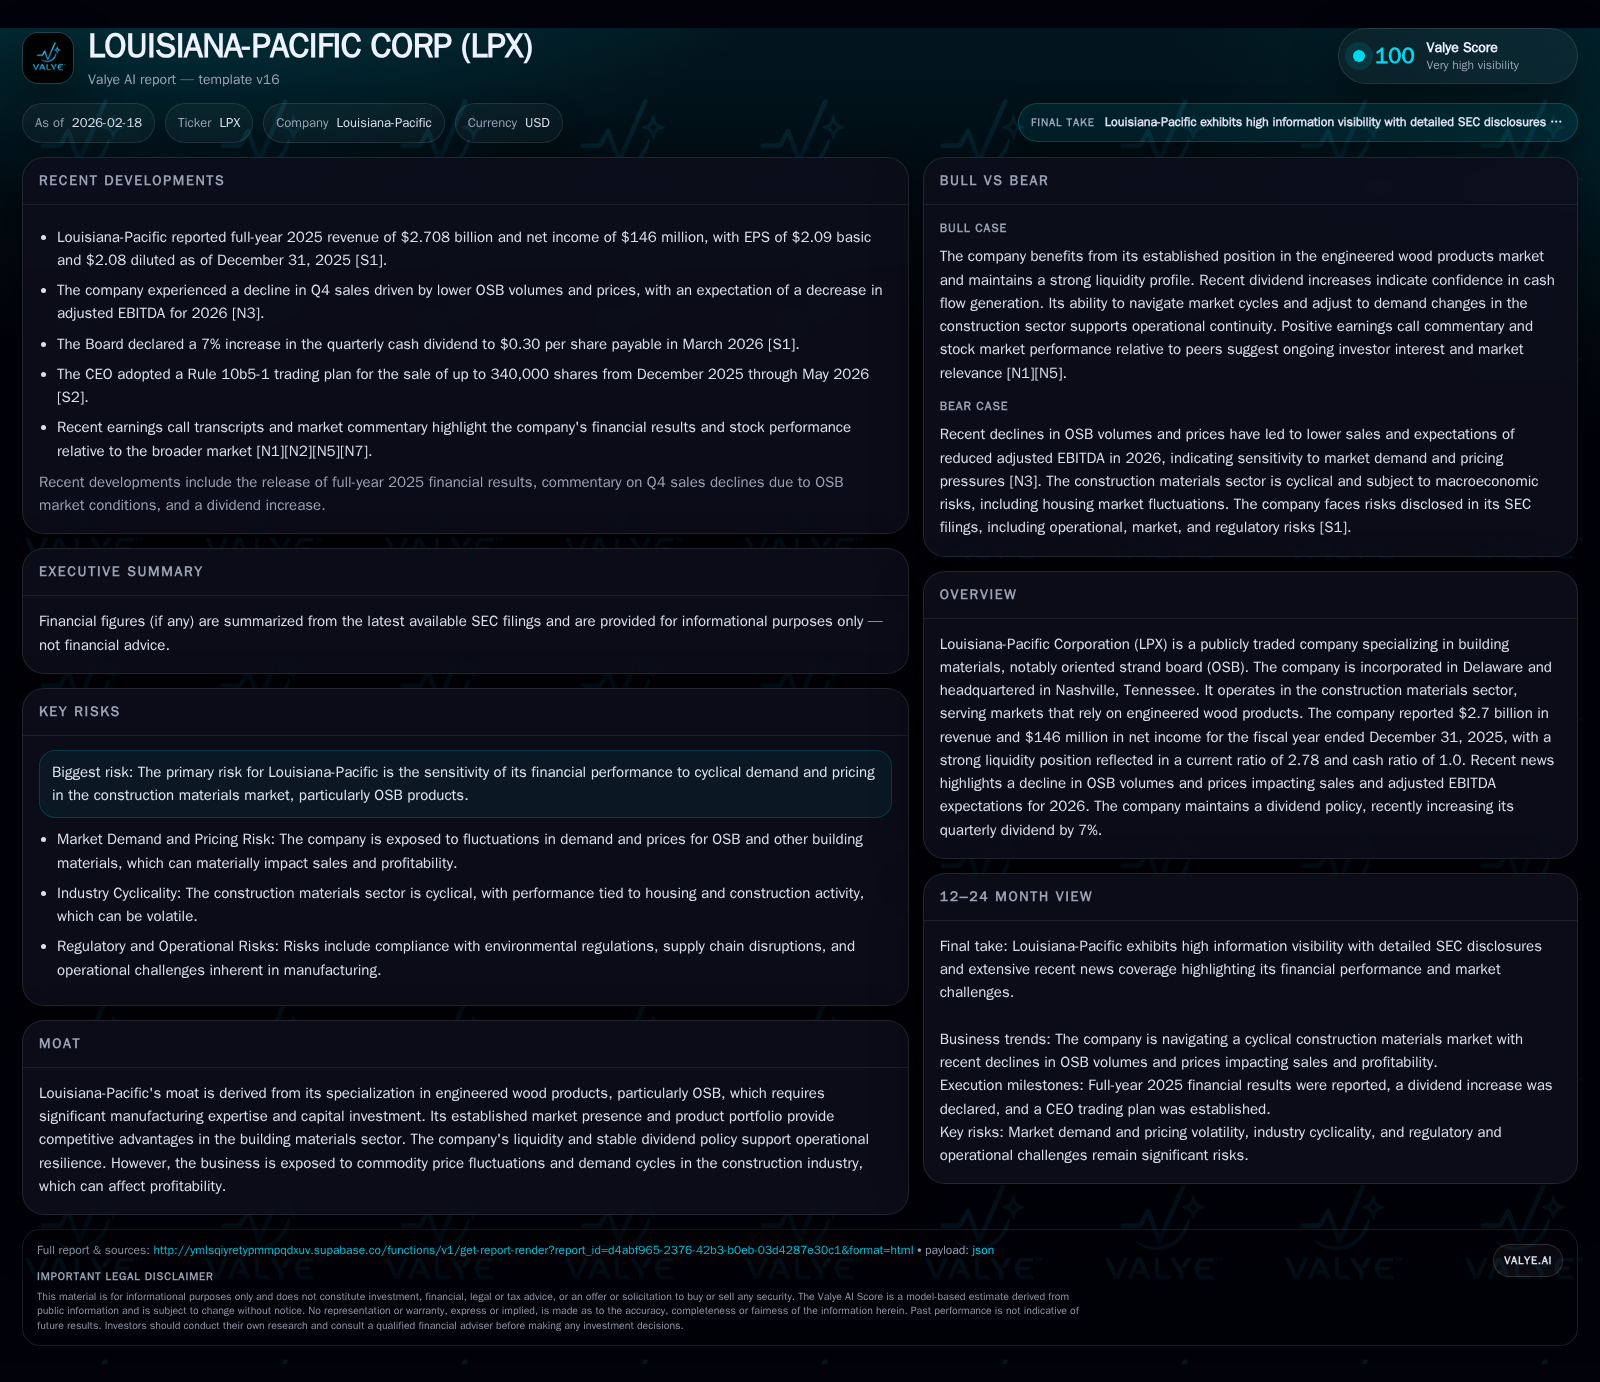
Louisiana-Pacific Corporation experienced a notable decrease in revenues and operating income in 2025, driven primarily by declines in oriented strand board (OSB) volumes and prices. Despite these headwinds compressing profitability and cash flow, the company has continued to prioritize shareholder returns, evidenced by a 7% increase in its quarterly dividend. Capital expenditures have risen sharply as LPX invests in operational capacity and maintenance amid a cyclical downturn in engineered wood markets. Going forward, margins are expected to remain under pressure, with adjusted EBITDA forecasted to decline further in 2026. Investors should monitor raw material costs, capacity utilization rates, and demand recovery as key indicators of financial health.
2025 Earnings and Revenue Declines: Tracing the Impact of OSB Price and Volume Contraction
Louisiana-Pacific Corporation's top-line performance for fiscal year 2025 reflected pronounced headwinds stemming from both volume and pricing pressures in its core oriented strand board (OSB) product line. Revenues contracted nearly 7.9% year-over-year to $2.71 billion, down from $2.94 billion in 2024 [F1]. This decline tracks industry-wide softness as excess supply dynamics coupled with subdued construction activity exerted downward pricing pressure on OSB products [N4]. Operating income suffered an even sharper setback, plunging by approximately 60.6% YoY to $209 million compared with $530 million the prior year [F1], underscoring how cyclicality impacted not only revenues but also margins through unfavorable operating leverage effects.
These results illustrate LPX's direct exposure to the cyclical pricing mechanism inherent in engineered wood markets where price realization profoundly influences operating profitability despite the scale of operations. The falloff in OSB fabrication volumes alongside diminishing average sales prices contracted the company's earning power through both the gross profit line and absorptive manufacturing costs [N4][F1]. This vulnerability demonstrates how OSB market cycles translate into tangible financial stress even for established manufacturers like LPX.
Engineered Wood Market Dynamics Shaping Louisiana-Pacific's Growth Outlook
LPX operates predominantly within the engineered wood segment characterized by capital-intensive manufacturing processes requiring specialized facility overlays for composite boards such as OSB with engineered composite overlays [S1]. The supply chain intricacies—including logging resource availability, transportation logistics, and labor skillsets—add layers of complexity that underpin its competitive moat.
Market demand is tightly correlated with broader construction sector trends including residential starts and renovation activity which can fluctuate seasonally or with economic cycles [N1][S1]. Capacity utilization rates serve as a critical indicator; downturns depress throughput leading to underabsorption of fixed production costs which then exacerbates earnings volatility.
Moreover, cycle time improvements remain an operational focus aimed at mitigating margin pressures by enhancing manufacturing efficiencies and throughput velocity [S1][N1], providing some buffer against cost inflation or volume contraction scenarios.
Outlook for 2026 Adjusted EBITDA and Key Performance Indicators to Watch
Guidance issued for fiscal year 2026 signals expectations for adjusted EBITDA contraction attributable largely to continued softness in OSB pricing coupled with volume uncertainties [N4]. Margin compression remains a key challenge amidst ongoing fluctuations in raw material input costs including wood fiber prices and resin components.
Key performance indicators investors should closely monitor include changes in average selling prices for OSB relative to industry benchmarks, shifts in fabrication volumes that signal improving or deteriorating demand profiles, input cost trends particularly resin and fiber expenses impacting gross margins, as well as any operational adjustments influencing cycle times or capacity usage.
Absent explicit quantified forward guidance beyond EBITDA direction [N4], these metrics will serve as critical barometers for when margin recovery might begin transitioning from outlook into measurable results.
Capital Allocation Amid Downturn: Rising Capex and Steady Returns to Shareholders
Against a backdrop of earnings contraction, Louisiana-Pacific has strategically increased capital expenditures by roughly 59% year-over-year—to $291 million in FY2025 from $183 million the prior year—investing heavily in plant maintenance and capacity enhancements designed to position the company favorably once market conditions improve [F1].
Simultaneously, LPX maintained a disciplined approach toward shareholder returns. The quarterly dividend was raised approximately 7%—from $0.28 to $0.30 per share—highlighting a commitment to dividend continuity despite margin pressures [N11][S11][S12]. However, share repurchase activity decelerated significantly; buybacks totaled $61 million versus $212 million the previous year reflecting a deliberate reallocation toward sustaining operations amid uncertain near-term demand [F1].
This balancing act exemplifies capital stewardship where reinvestment requirements contend with return-of-capital priorities under cyclical stress.
ROE Trends and Free Cash Flow Amid Volatile Demand
LPX's approximate return on equity declined meaningfully yet remained moderately positive at about 8.4% based on FY2025 net income of $146 million over equity totaling $1.73 billion [F1]. Net income itself contracted over 65% YoY from the prior year's $420 million as margin erosion weighed heavily on bottom-line results.
Operating cash flow fell by nearly 37% YoY to $382 million while elevated capex reduced free cash flow (defined here as CFO minus capex) to approximately $91 million—a sharp compression compared with preceding periods—signaling tighter internal funding flexibility if market softness endures [F1]. Given high fixed manufacturing costs characterizing engineered wood production lines, constrained free cash flow further underscores earnings sensitivity when volumes diminish.
Understanding Operational Leverage in Engineered Wood Manufacturing
Operational leverage plays a pivotal role at LPX due to substantial fixed costs spanning labor commitments, energy consumption for continuous presses, and depreciation associated with expensive overlay machinery employed in OSB fabrication [S1][N1]. When capacity utilization dips below optimal thresholds during downturns, fixed expenses do not abate proportionally creating amplified impacts on operating profits.
Variable input costs—such as raw fiber procurement and resin supplies—though significant, fluctuate more closely with output levels offering partial mitigation against fixed cost rigidity.
Cycle time improvement initiatives aim at compressing throughput durations without sacrificing quality; this can lead to better absorption of overheads per unit produced but requires sustained investment and stable demand profiles [S1]. Consequently, shifts in utilization rates provide a leading indicator for EPS volatility as operational gearing magnifies margin swings across business cycles.
Dividend Policy: Signaling Stability Despite Margin Pressures
In January-February 2026 filings and press releases including an official announcement dated February 13th—the Board declared a new quarterly dividend increase of about 7%, raising payouts from $0.28 to $0.30 per share effective March payout dates [N11][S11][S12].
This dividend resilience reflects management's intent to convey confidence in long-term cash flow generation capacity despite anticipated short-term profit softness corroborated by expected adjusted EBITDA declines [N4]. Dividend coverage ratios have likely compressed but remain intact within prudent payout ranges typical for capital-intensive industrial players navigating cyclical troughs.
From an investor relations perspective, maintaining dividends during downturns offers reassurance regarding financial discipline while affirming smooth payout trajectories amid fluctuating earnings dynamics.
Risk Factors: Cyclicality, Commodity Exposure, and Regulatory Uncertainty
Recent risk disclosures reaffirm that LPX remains vulnerable to cyclical swings inherent in residential construction markets which drive OSB demand patterns alongside evolving raw material cost environments notably wood fiber pricing volatility induced by supply-demand imbalances or geopolitical factors affecting resin availability [S4][S5][S6].
Price elasticity of demand within engineered wood compounds revenue unpredictability especially when substitution options or imports alter competitive landscape pricing power.
Furthermore, legal contingencies detailed highlight potential liabilities or regulatory exposures that could impose ancillary costs or operational constraints thereby increasing uncertainty layers beyond commodity cycles alone.
Understanding these risks is vital since they underscore earnings variability drivers distinctively influencing LPX’s cyclically sensitive business model.
Historical Financial Summary FY2022–FY2025
Historical performance (annual)
| FY | Rev ($bn) | Net ($mm) | CFO ($mm) | OpInc ($mm) | Rev YoY | Net YoY |
|---|---|---|---|---|---|---|
| 2025 | 2.7 | 146 | 382 | 209 | -7.9% | -65.2% |
| 2024 | 2.9 | 420 | 605 | 530 | +13.9% | +136.0% |
| 2023 | 2.6 | 178 | 316 | 287 | -33.0% | -83.6% |
| 2022 | 3.9 | 1086 | 1144 | 1250 |
Note: Omitted columns lack sufficient annual XBRL coverage in the provided tags (need ≥2 annual points): Capex. Source: SEC companyfacts cache [F1].
Capital returns and efficiency (annual)
| FY | Div ($mm) | Buybacks ($mm) | FCF ($mm) |
|---|---|---|---|
| 2025 | 78 | 61 | 91 |
| 2024 | 74 | 212 | 422 |
| 2023 | 69 | 0 | 16 |
| 2022 | 69 | 900 | 732 |
Source: SEC companyfacts cache [F1]. Omitted columns: Operating margin %, ROE %, due to insufficient consistent historical disclosure.
The data above illustrates the sharp retrenchment beginning after the peak revenue year of FY2022 caused principally by cyclical housing construction downturns that heavily impacted LPX’s core OSB volumes/prices leading directly into subsequent profitability compression since early-2023 through FY25 [F1].
Disclaimer: This analysis is based solely on publicly available information through SEC filings and recent news reports as cited; it does not represent investment advice or recommendations concerning Louisiana-Pacific Corporation securities or their value potential.
Disclaimer: This is research-only, informational analysis and not investment advice. It may include AI-generated interpretation and general industry context. Always verify important details using primary sources.
Comments