
MAXIMUS Q3 2026: Revenue Decline and Margin Expansion Amid Contract and Collection Challenges
MAXIMUS reported a 5.2% revenue decline in Q3 2026 driven by organic volume decreases and business disposals, alongside margin expansion and increased collection delays.
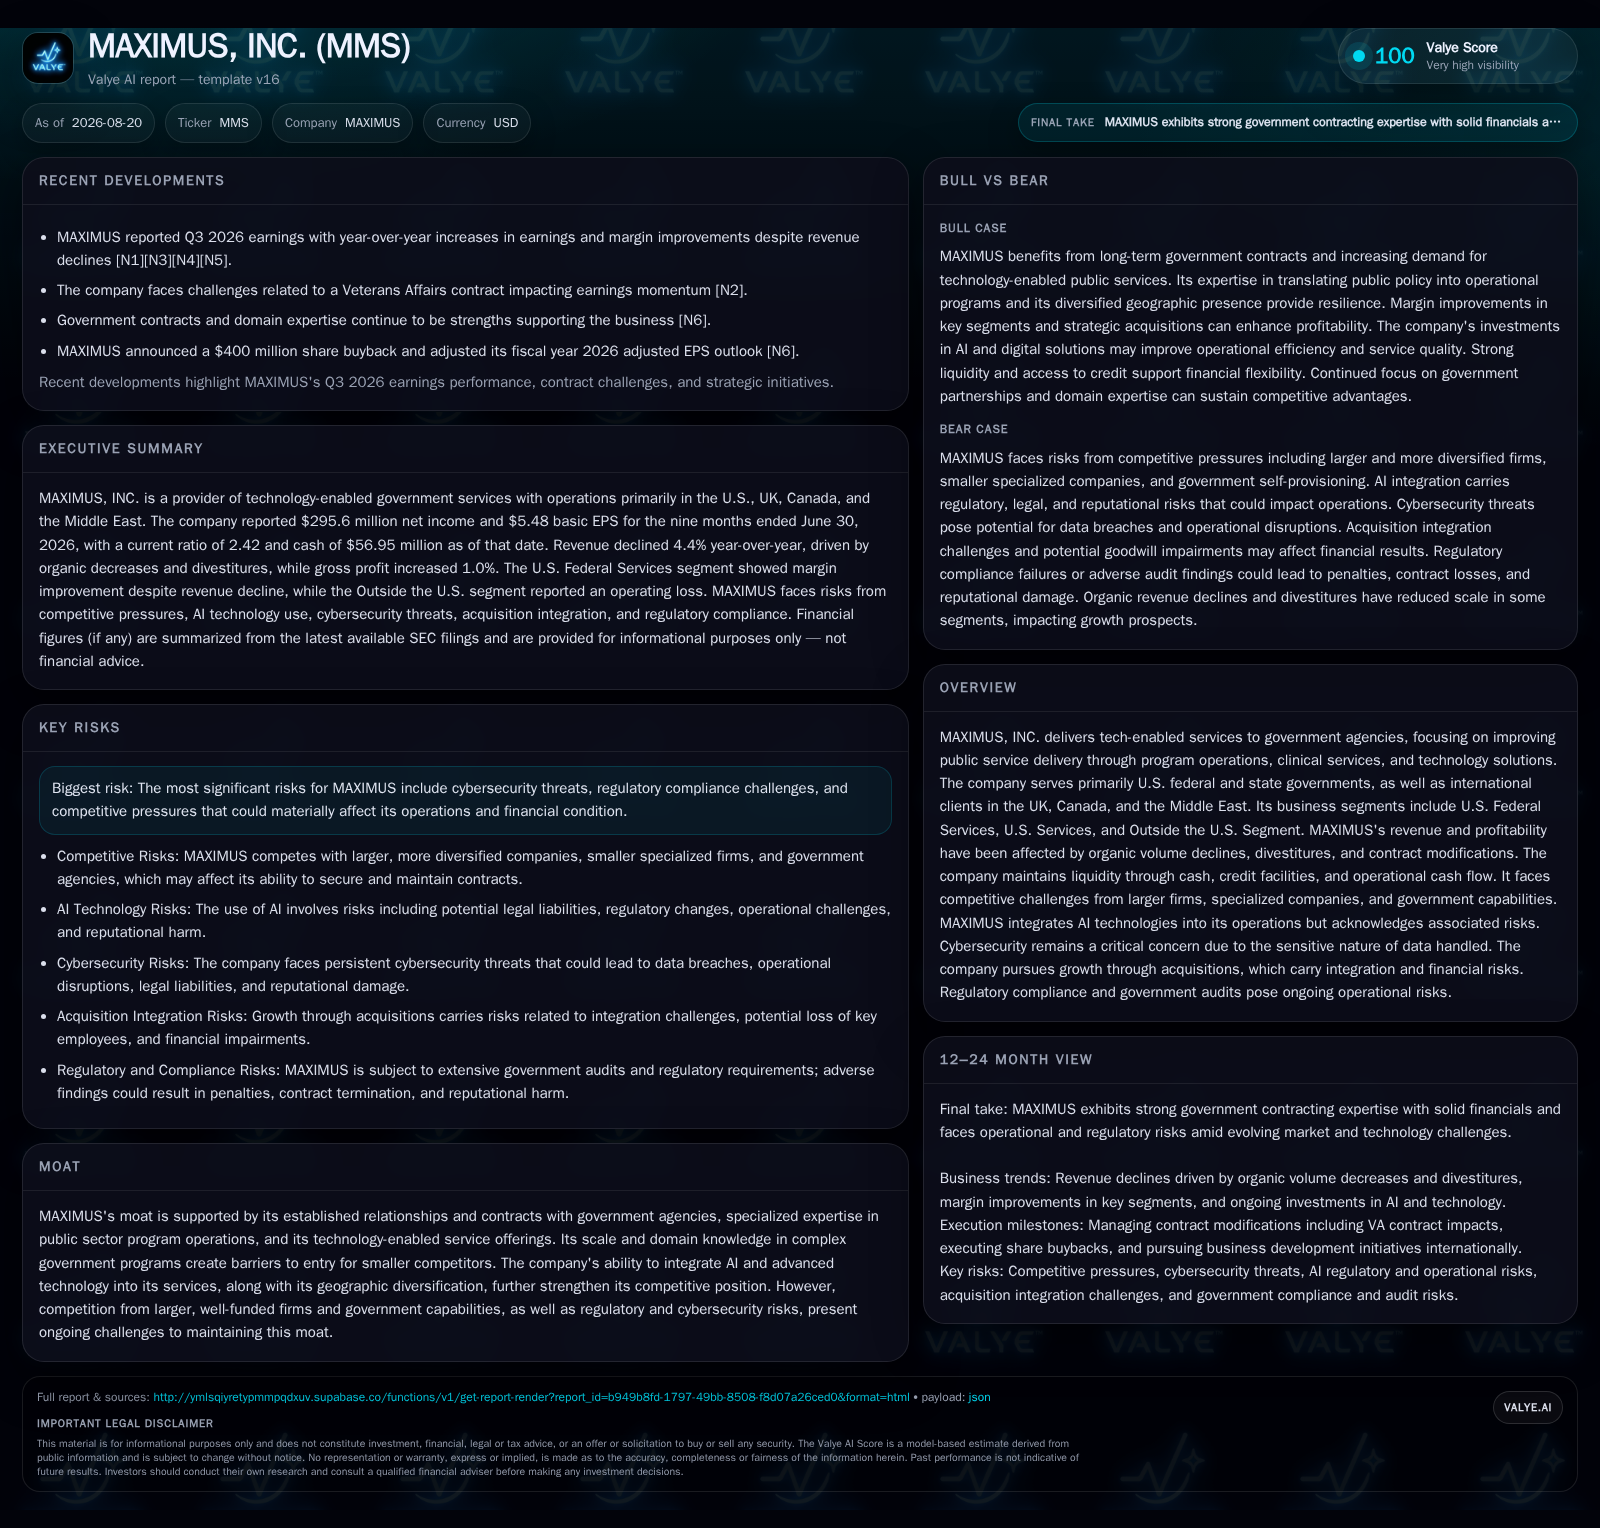
In the third quarter of fiscal 2026, MAXIMUS experienced a 5.2% year-over-year revenue decline to $1.279 billion, primarily due to lower organic volumes and business disposals. Despite this pressure, gross margin expanded to 27.3% from 26.7%, reflecting effective cost control and operational efficiencies. However, Days Sales Outstanding (DSO) rose significantly to 98 days, signaling short-term cash collection delays that impact working capital. The company maintains a solid liquidity position with $57.0 million in cash, a $750 million revolving credit facility, and a $350 million Receivables Purchase Agreement, while remaining compliant with all credit covenants. Investors are focused on whether MAXIMUS can stabilize revenue and manage working capital pressures while sustaining margin improvements and liquidity to support dividends and capital allocation.
Q3 2026 Operating Performance Update
MAXIMUS, Inc. reported a 5.2% year-over-year decline in revenue for the third quarter ended June 30, 2026, with total revenue falling to $1.279 billion from $1.348 billion in the same period of 2025 [S2]. This decline was primarily driven by organic volume decreases and the disposal of certain businesses, partially offset by favorable currency effects. For the nine months ended June 30, 2026, revenue declined 4.4%, including a 3.9% organic reduction and a 0.8% impact from disposals, underscoring that the volume pressure is a persistent structural challenge rather than a temporary fluctuation [S2].
Despite the revenue contraction, MAXIMUS achieved a slight increase in gross profit margin, expanding to 27.3% in Q3 2026 from 26.7% in Q3 2025, driven by cost control and operational efficiencies [S2]. Gross profit was $348.8 million in Q3 2026, down marginally from $359.5 million a year earlier [S2]. The cost of revenue reduction outpaced the revenue decline, indicating disciplined management of labor and subcontractor costs, which constitute a significant portion of cost of revenue in this labor-intensive government services business [S2].
A notable development was the increase in Days Sales Outstanding (DSO), which rose to 98 days at June 30, 2026, from 62 days at September 30, 2025 [S2]. This increase reflects short-term delays in cash collections from government clients, a common working capital challenge in the government tech-enabled services sector due to reimbursement cycles and contract payment timing. Excluding the effects of the Receivables Purchase Agreement (RPA), DSO would have been even higher at 123 days, highlighting the significance of these collection delays [S2].
Total debt stood at $1.653 billion, with a current ratio of 2.42, indicating that current assets comfortably cover current liabilities [F1]. The company was in compliance with all credit agreement covenants at quarter-end and does not view these covenants as a significant operational or dividend payment constraint [S2].
Operating income for Q3 2026 was $161.4 million, slightly down from $165.7 million in Q3 2025, but operating margin improved to 12.6% from 12.3%, reflecting the margin expansion despite revenue pressure [S2]. Selling, general, and administrative expenses decreased modestly in absolute terms and as a percentage of revenue, indicating ongoing cost discipline [S2]. Interest expense increased slightly to $23.9 million from $22.7 million, consistent with the company’s debt levels [S2].
Business Model and Competitive Positioning
MAXIMUS operates primarily as a provider of technology-enabled services to government agencies at the federal and state levels in the U.S., as well as internationally in the U.K., Canada, and the Middle East [S1][S2]. The company delivers public service program operations, clinical services such as health assessments and independent medical reviews, and technology solutions aimed at improving government service delivery. Revenue is generated through fees earned under government contracts, which are largely labor-intensive and involve significant subcontractor participation [S1].
Margins in this sector are heavily influenced by labor cost management, subcontractor efficiency, and contract pricing. MAXIMUS's established relationships and specialized expertise create competitive barriers, although the company faces competition from larger diversified contractors, specialized firms, and government agencies' own capabilities [S1]. Contract volume fluctuations, modifications, and government budget priorities are key drivers of revenue and profitability.
The company’s revenue mechanics depend on the volume and scope of government contracts, which can be affected by policy changes, budget constraints, and competitive bidding outcomes [S1][S2]. Labor costs, including subcontracted labor, constitute approximately two-thirds of cost of revenue, making operational efficiency and cost control critical to margin performance
Risks and Scenario Analysis
The revenue decline observed in Q3 2026 appears largely structural, stemming from ongoing organic volume decreases and business disposals rather than temporary factors [S2]. This signals persistent challenges in contract renewals and competitive pressures within the government services market. The nine-month organic revenue decline of 3.9% and the additional 0.8% impact from disposals indicate that these pressures are not isolated events but reflect a broader trend [S2].
Conversely, the expansion in gross margin despite lower revenue suggests that MAXIMUS has been successful in managing costs and improving operational efficiency, partially offsetting earnings pressure from declining volumes [S2]. The gross margin increase from 26.7% to 27.3% in Q3 2026, coupled with a slight reduction in selling, general, and administrative expenses as a percentage of revenue, demonstrates effective cost discipline and operational leverage [S2].
Working capital management is a key risk area, as the increase in Days Sales Outstanding (DSO) to 98 days (and 123 days excluding the Receivables Purchase Agreement) indicates short-term collection delays that could pressure cash flow and liquidity if prolonged [S2]
Looking ahead, a bull case scenario would see MAXIMUS stabilize or grow revenue through successful contract renewals and new awards, sustain margin expansion through continued cost discipline, and improve working capital metrics by reducing DSO. This would support earnings growth and maintain dividend capacity [S2][S1][F1]. Key confirming indicators would include revenue stabilization or growth, sustained or improved margins, and normalization of DSO and cash flow.
Conversely, a bear case would involve continued revenue declines due to competitive losses and contract modifications, worsening working capital pressures with further DSO increases, margin compression from rising costs or inefficiencies, and potential liquidity strain. These factors will be critical to assessing MAXIMUS's ability to reverse recent declines, sustain profitability, and support its capital allocation plans.
Grounded Watchpoint
Investors should closely monitor upcoming quarterly revenue trends and organic volume changes, as these will be the primary indicators of whether MAXIMUS can arrest the structural decline in contract volumes. Additionally, the trajectory of gross margins will reveal the company’s ability to maintain cost efficiencies amid revenue pressure.
The near-term outlook hinges on the company’s ability to stabilize revenue and improve working capital efficiency while sustaining margin gains. The balance of these factors will determine whether MAXIMUS can support its dividend and capital allocation strategies in a competitive and budget-constrained government services environment.
Disclaimer: This is research-only, informational analysis and not investment advice. It may include AI-generated interpretation and general industry context. Always verify important details using primary sources.

Comments