
MPLX LP’s Earnings Upswing and Capital Strategy Highlight Midstream Resilience
Strong throughput growth and targeted capital investment underpin MPLX’s ongoing operational and financial strength amid concentrated contractual relationships.
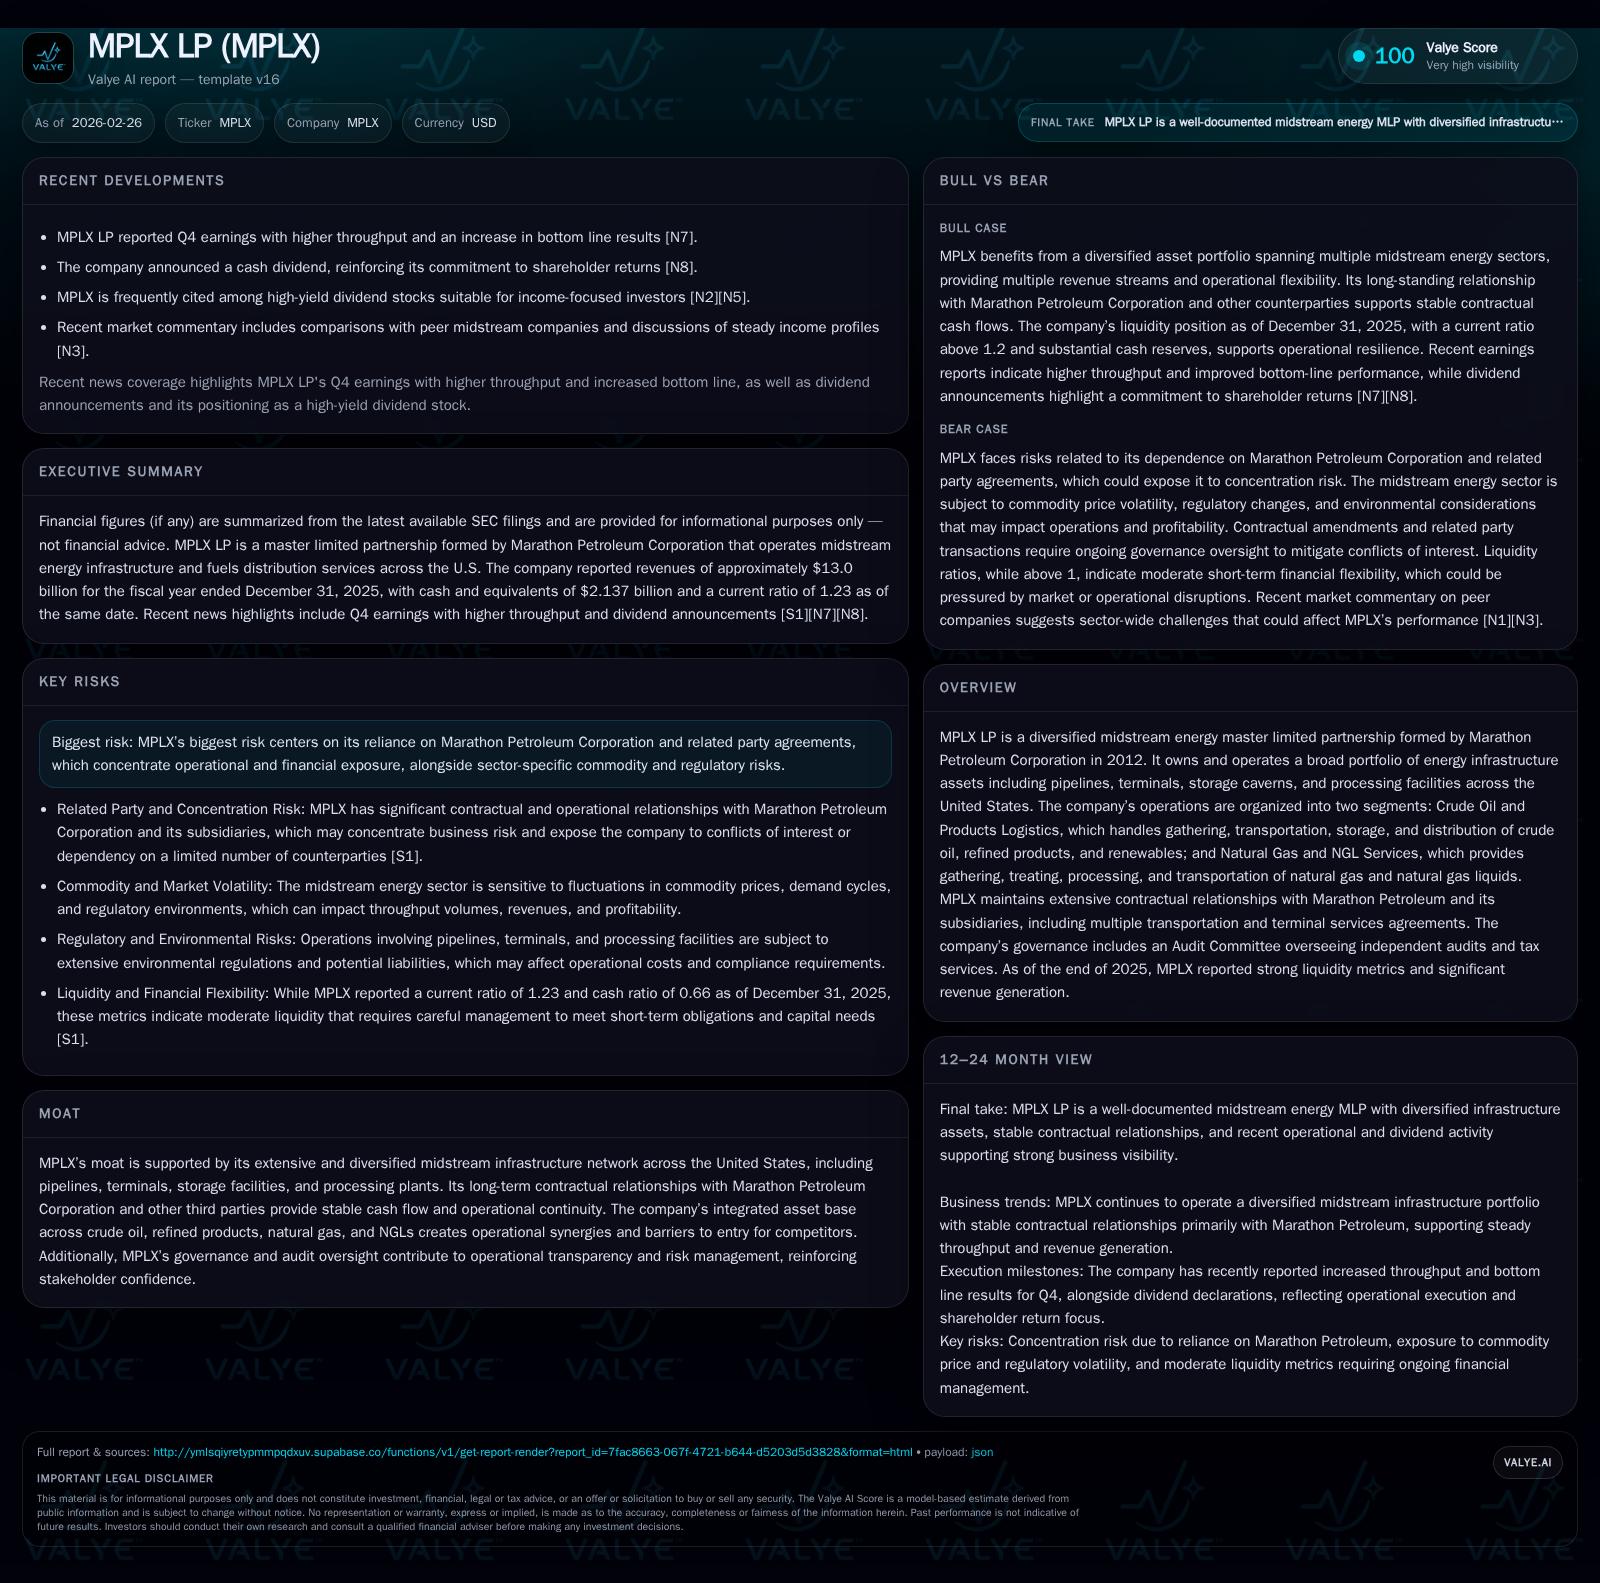
MPLX LP demonstrated robust financial performance in FY2025, with revenue increasing nearly 9% year-over-year, driven predominantly by elevated throughput volumes across its midstream infrastructure. The company’s dual segments — Crude Oil and Products Logistics and Natural Gas and NGL Services — benefit from integrated asset synergies and long-term contracts primarily with Marathon Petroleum Corporation, providing stable cash flow amid an evolving energy market. Notably, MPLX significantly accelerated capital expenditures by over 70% in FY2025 to expand and modernize its asset base, while maintaining disciplined shareholder returns through dividends and buybacks supported by strong free cash flow generation. However, reliance on a concentrated set of related-party contracts while navigating regulatory challenges remains a key risk factor to monitor.
Financial Performance Trajectory: Revenue Expansion and Operating Efficiency Evolution
MPLX LP's financial results from fiscal years 2022 through 2025 demonstrate a consistent growth trajectory underpinned by strategic throughput expansion and operational leverage. The company's revenue rose from $11.61 billion in FY2022 to $12.998 billion in FY2025, marking a near 9% compound annual growth rate over the last two years [F1]. Operating income increased notably faster than revenue during this period — from approximately $4.91 billion in FY2022 to $5.94 billion in FY2025 — indicating that efficiency improvements in operations complemented top-line gains.
Net income remained relatively stable at around $3.92 billion in the latest reported periods although flat YoY changes suggest some earnings volatility possibly tied to commodity-linked fees or cost changes [F1]. Meanwhile, operating cash flow exhibited steady growth but slightly tapered off in FY2025 compared to prior years, standing at roughly $5.91 billion. The standout aspect is a sharp rise in capital expenditures from $806 million in FY2022 to $1.81 billion in FY2025 — illustrating MPLX’s commitment to scaling infrastructure capacity or upgrading existing assets.
Historical performance (annual)
| FY | Rev ($bn) | Net ($bn) | CFO ($bn) | OpInc ($bn) | Rev YoY | Net YoY |
|---|---|---|---|---|---|---|
| 2025 | 13.0 | 5.9 | 5.9 | +8.9% | ||
| 2024 | 11.9 | 5.9 | 5.3 | +5.8% | ||
| 2023 | 11.3 | 3.9 | 5.4 | 4.9 | -2.9% | -0.4% |
| 2022 | 11.6 | 3.9 | 5.0 | 4.9 | +28.2% |
Source: SEC companyfacts cache [F1].
Capital returns and efficiency (annual)
| FY | Buybacks ($mm) | FCF ($bn) |
|---|---|---|
| 2025 | 400 | 4.1 |
| 2024 | 326 | 4.9 |
| 2023 | 0 | 4.5 |
| 2022 | 491 | 4.2 |
Source: SEC companyfacts cache [F1].
Contractual Foundations and Segment Synergies Shaping Operations
MPLX operates two main segments: Crude Oil and Products Logistics alongside Natural Gas and NGL Services [S1][S6]. The Crude Oil and Products Logistics segment covers gathering, transportation, storage, refining logistics, fuels distribution, terminals, rail facilities, inland marine operations, storage caverns, and related distribution assets primarily focusing on crude oil plus refined products including renewables . The Natural Gas and NGL Services segment provides wellhead-to-market services such as gathering systems for natural gas liquids (NGLs), treating processes, fractionation facilities, and transportation infrastructure.
A defining feature of MPLX’s business model is its extensive web of long-term related-party contracts with Marathon Petroleum Corporation (MPC) and affiliates [S6]. These include transportation services agreements across multiple pipeline systems (e.g., Catlettsburg-Robinson crude system), terminal services arrangements, fuels distribution agreements as well as amendments securing ongoing utilization rights [S7][S8][S9][S10]. This related-party contractual framework delivers significant cash flow stability due to fixed-fee structures or volume thresholds guaranteed by Marathon’s operating needs.
Operationally these contracts facilitate efficient asset integration — for instance linking refined product logistics directly into MPC refinery outputs or leveraging NGL processing plants tied closely with upstream gas supplies associated with Marathon’s upstream interests . The resulting synergies create barriers for new entrants because comparable infrastructure requires prohibitive capital investments coupled with equally robust commercial agreements.
Governance oversight adds another layer of control; MPLX’s independent Audit Committee ensures transparent financial reporting standards are upheld through external audits by PricewaterhouseCoopers LLP along with strict pre-approval policies on audit-related services [S1][S6][S11].
Throughput Growth as the Modern Driver of Earnings Beats
Recent earnings releases confirm that throughput volume increases remain the proximate driver behind MPLX’s financial upside relative to consensus estimates [N3][N14]. Q4 earnings beat expectations decisively as enhanced crude oil pipeline utilization coupled with elevated NGL processing volumes offset inflationary pressures on operating expenses.
This throughput-led boost manifests directly in higher revenues as volume-based fee components scale up alongside tariff adjustments embedded within long-term contracts [N3]. Correspondingly operating income climbed ahead of revenue growth rates in FY2025 highlighting improved operating leverage during periods of rising activity levels [F1].
Such dynamics contrast with other midstream peers suffering throughput softness or elevated costs leading to earnings misses—as evidenced by contemporaneous reports from WES facing declines due to lower throughput combined with expense spikes [N1], underscoring MPLX’s competitive resilience.
Capital Spending Uptick and Investment Focus: Scaling Infrastructure for Future Demand
Capital expenditures expanded markedly by over 70%, rising from approximately $1.06 billion in FY2024 to about $1.81 billion in FY2025 [F1]. This step-change investment reflects purposeful deployment into pipeline expansion projects, modernization of existing gathering systems, terminal upgrades including automation enhancements plus likely incremental fractionation facility capacity aligned with growing natural gas liquids demand profiles noted on earnings calls [N3].
The company indicates intent to support future demand increases while preserving asset integrity across its geographically diversified network extending across multiple US basins [N3]. Importantly this capex increase has not been accompanied by marked deterioration in operating cash flow suggesting prudent financial risk management around project execution timelines.
Shareholder Returns: Dividends, Buybacks, and Return on Equity Dynamics
MPLX maintains a disciplined capital allocation framework balancing regular cash distributions with opportunistic share repurchases reflecting confidence anchored in free cash flow generation capabilities.
Dividend declarations continue steadily as affirmed shortly before the end of calendar year 2025 announcements enhancing yield attractiveness against midstream peers [N4][S18]. Share repurchase activity intensified notably—absent during FY2023 but resumed to $326 million in FY2024 then stepped up further to around $400 million for FY2025 — reinforcing management’s intent to deploy excess capital effectively rather than accumulate idle cash balances [F1].[S26][S27]
Given net income around $3.92 billion against equity base estimates spanning several years prior but approximating near $9-10 billion range historically estimated return on equity exceeds roughly 40%, exceptional for an MLP entity typically characterized by more moderate ROE benchmarks given hedged income streams and payout obligations [F1]. This level illustrates impressive capital allocation efficiency achieved through contracted revenue backbone combined with operational scalability.
Free cash flow calculated as CFO less capex approximates just over $4 billion annually providing solid coverage for dividend commitments plus buybacks without material dependence on external financing sources [F1].
Key Risks from Contract Concentration and Regulatory Environments
A central risk factor articulated repeatedly is MPLX's heavy reliance on contractual arrangements primarily tied to Marathon Petroleum Corporation entities which underwrite the lion’s share of operational volumes plus remuneration mechanisms [S4][S6]. While this generates predictability it simultaneously exposes MPLX to counterparty concentration risks where any material adjustment or disruption could disproportionately impact results compared to more diversified midstream operators.
Regulatory risks typical for midstream infrastructure—such as pipeline safety oversight actions, environmental regulations tightening emissions or storage conditions—and eventual modifications in tariffs/fee structures can influence net margins or operational flexibility requiring continuous monitoring [S11][S17]. These represent ongoing sector-wide headwinds persisting alongside transitional energy themes that could pressure demand patterns for fossil fuel pipelines albeit mitigated partially by increasing renewables logistics integration noted within MPLX's scope.
Looking Ahead: Metrics to Watch in MPLX's Growth and Operational Stability
Absent explicit forward guidance published across documents or calls ([N5],[N3],[S18]), key indicators market participants should observe include continued quarterly throughput metrics segmented between crude oil/products logistics versus natural gas/NGL processing volumes signaling sustained demand traction.
Margins deserve scrutiny given capex escalation—reflecting either ramp-up phase cost absorption or pricing pass-through efficacy measuring whether operating income growth can keep pace.
Dividend sustainability deriving from free cash flow relative to declared payouts will also be revealing regarding balance sheet strength especially if potential contract renegotiations or expansions come into play toward contract maturities discussed on earnings calls.
Buyback cadence serves as a barometer for management confidence about surplus liquidity beyond organic reinvestment needs.
Finally regulatory filings should be watched for updates on compliance measures impacting infrastructure approval cycles or tariff recalibrations affecting revenue stability.
This analysis synthesizes publicly filed SEC data and recent news reporting without extrapolation beyond documented information points; no investment recommendations are offered herein.
Disclaimer: This is research-only, informational analysis and not investment advice. It may include AI-generated interpretation and general industry context. Always verify important details using primary sources.
Comments