
Canterbury Park Holding Corp Faces Revenue Upswings and Casino Segment Pressures
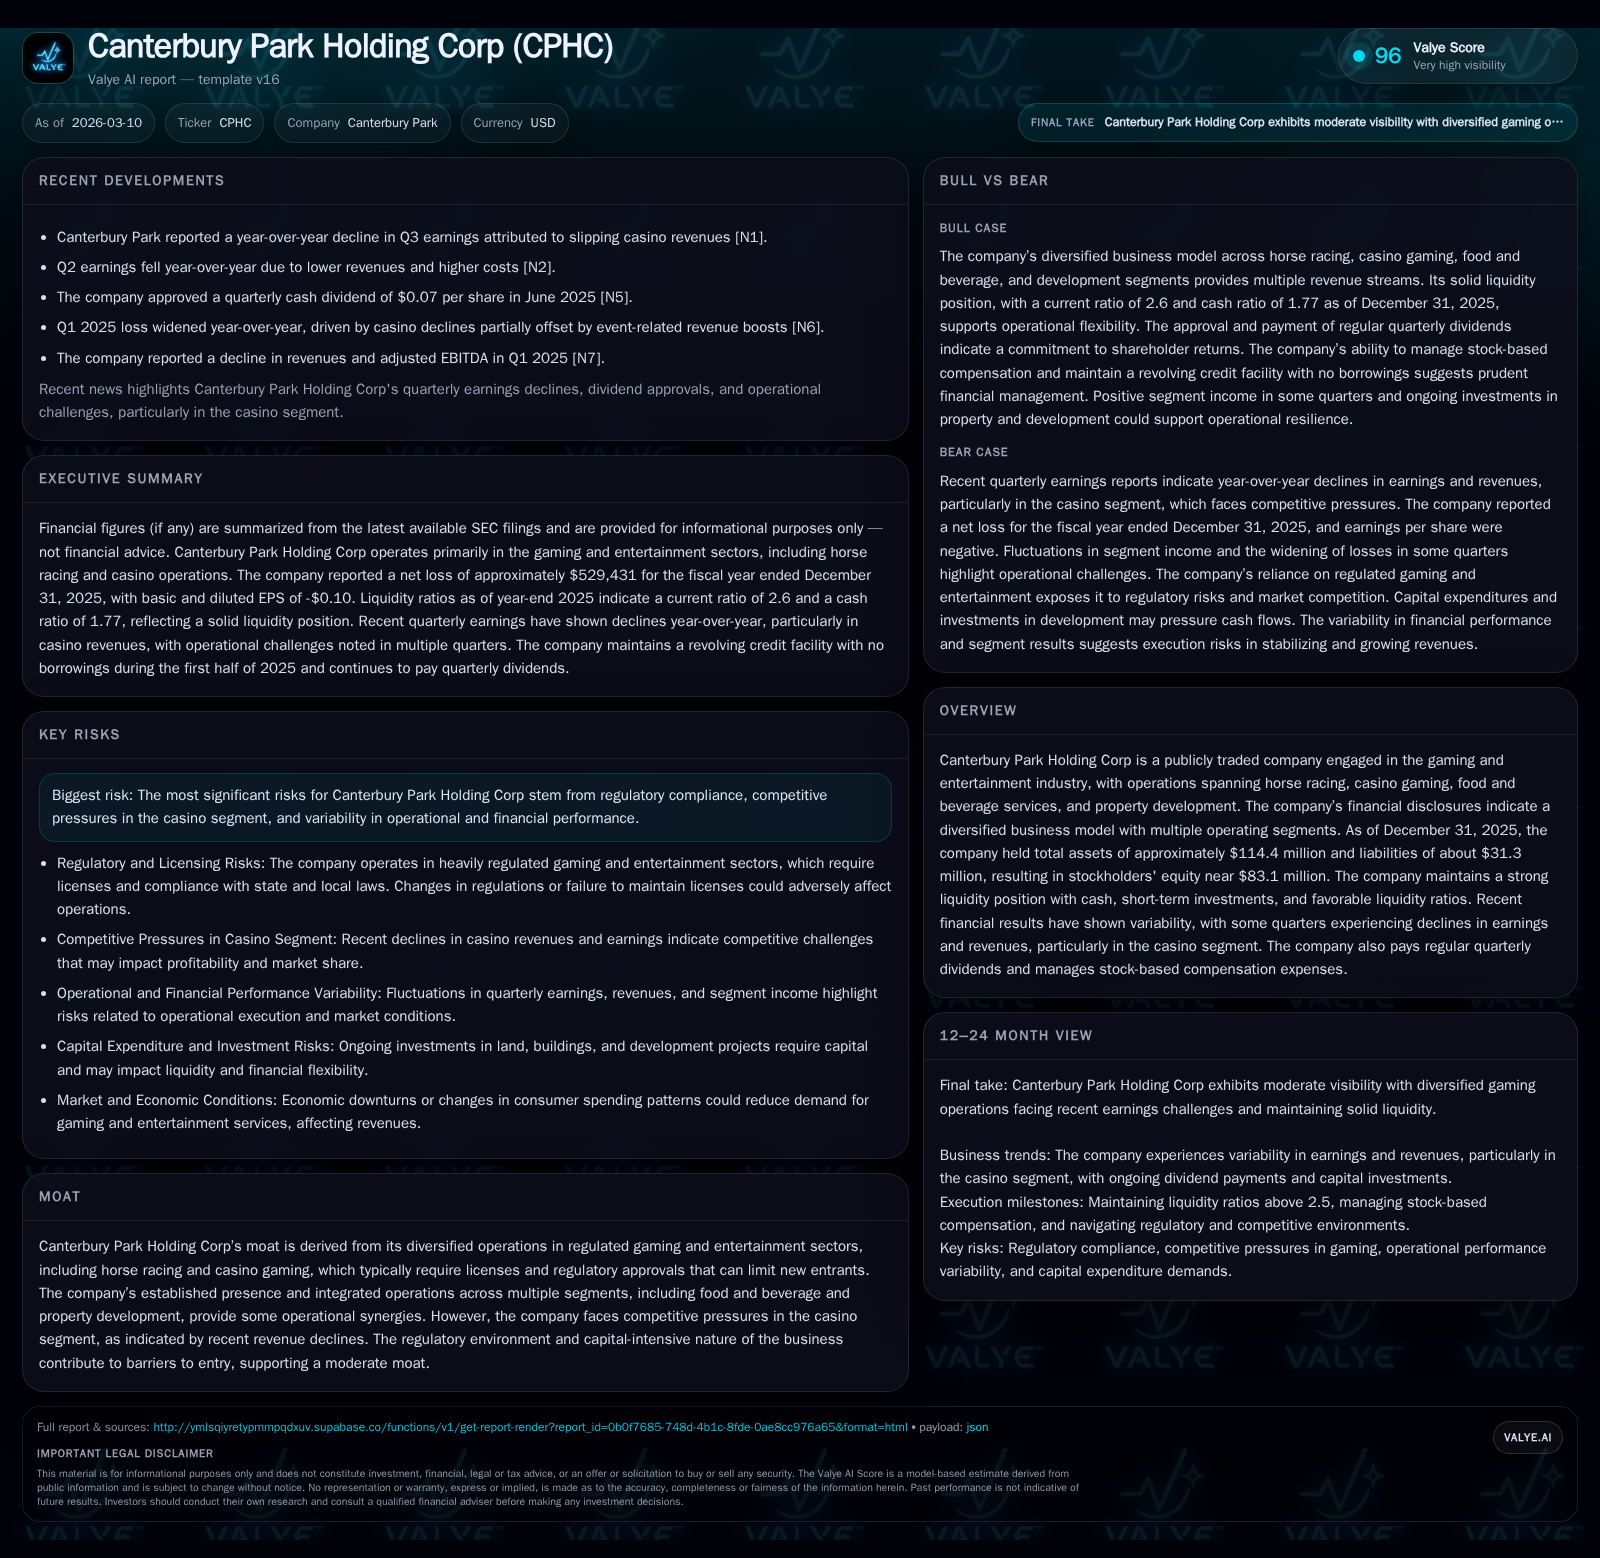
Canterbury Park’s 2025 financials reveal modest topline growth tempered by significant operating income contraction, spotlighting pressures in its casino operations.
In 2025, Canterbury Park Holding Corp registered a 4.7% increase in revenue driven primarily by steady horse racing and food & beverage segments; however, operating income declined sharply by 61.7%, largely due to challenges in the casino segment. Despite this, the company sustained robust operating cash flow and maintained a strong liquidity position with a current ratio near 2.6. Regular dividend payments continued, underscoring a commitment to shareholder returns amid volatile earnings. Going forward, recovery in casino patronage and regulatory developments will be pivotal for profitability stabilization.
Revenue Trajectory & Major Growth Drivers through 2025
Historical performance (annual)
| FY | Net ($mm) | CFO ($mm) | OpInc ($mm) | Net YoY |
|---|---|---|---|---|
| 2025 | -1 | 9 | 2 | -125.1% |
| 2024 | 2 | 6 | 6 | -80.0% |
| 2023 | 11 | 12 | 12 | +40.6% |
| 2022 | 8 | 11 | 11 |
Source: SEC companyfacts cache [F1].
Capital returns and efficiency (annual)
| FY | Div ($) | ROE% |
|---|---|---|
| 2025 | 1426238 | -0.6 |
| 2024 | 1405636 | 2.5 |
| 2023 | 1384773 | 12.9 |
| 2022 | 1360369 | 10.6 |
Source: SEC companyfacts cache [F1].
Canterbury Park Holding Corp has demonstrated moderate revenue growth over recent years, with revenue reaching approximately $12.6 million at the end of FY2019 [F1]. Year-over-year into FY2025, revenue increased by about 4.7% reflecting stable performance across diversified segments [F1]. This growth is primarily driven by steady horse racing activities fueled by parimutuel wagering alongside contributions from food and beverage services.
Horse racing revenues benefit from both live event wagers and simulcast fees earned from exporting racing signals to third-party wagering entities such as Off Track Betting locations and advance deposit wagering providers. The company acts as principal in these arrangements, reporting gross revenues with associated costs as operating expenses [S4][S8]. This model provides predictable cash flows given the recurring nature of wagers.
Casino Segment Headwinds and Competitive Dynamics
Despite overall revenue gains, the casino segment experienced significant pressure in 2025. Operating income declined sharply by approximately 61.7% YoY to about $2.46 million [F1], reflecting heightened competition and increased regulatory compliance costs [S3]. Regulatory oversight by the Minnesota Racing Commission imposes caps and auditing requirements that increase operational complexity and constrain margin expansion efforts [S16][S21]. Additionally, promotional allowances through player rewards programs create deferred liabilities impacting short-term profitability [S28]. These factors collectively challenge Canterbury Park’s ability to maintain prior profitability levels despite steady customer activity.
Diversification in Operations: Horse Racing, Food & Beverage, and Property Development
Canterbury Park's diversified business model extends beyond gaming into food & beverage operations integrated across racing events and the casino complex. This segment generates additional revenues during special events while remitting about 25% of gross proceeds back to horse racing for facility use rights, creating intersegment synergies that help smooth volatility inherent in gaming operations [S16][S21].
The development segment contributes through real estate projects related to core operations, supporting asset base growth via lease arrangements or joint ventures though direct revenues are limited or intermittent [S4][S16]. This diversification helps buffer against cyclical fluctuations specific to gaming.
Regulatory Environment’s Impact on Financial Performance
Licensing mandates from state regulators coupled with audit obligations impose significant administrative overhead on Canterbury Park Holding Corp [S3]. The capital-intensive nature of the business arises partly from infrastructure investments needed to comply with prescribed standards including security requirements.
Legal contingencies exist but no material litigation impact is currently reported; risks primarily relate to maintaining continuous license eligibility amid evolving regulatory criteria [S1][S3]. These compliance costs elevate SG&A expenses and can limit free cash flow generation during periods of margin pressure.
Capital Structure, Liquidity Profile, and Revolving Credit Facility
As of December 31, 2025, Canterbury Park reported total assets near $114.4 million against liabilities around $31.3 million resulting in stockholders' equity approximately $83.9 million [F1][S4]. Current assets were about $25 million versus current liabilities below $10 million yielding a current ratio near 2.6—a sign of solid liquidity [F1]. Cash plus short-term investments totaled roughly $17 million providing ample reserves for working capital needs [S6][F1].
The company maintains a revolving credit facility capped at $5 million following amendments effective early 2024 which reduced borrowing capacity and released certain collateral agreements [S7]. No borrowings were outstanding on this line as of mid-2025 demonstrating conservative leverage use [S7][S20]. Covenants require maintenance of financial ratios preserving lender confidence.
Profitability Challenges Amid Negative Net Income Despite Strong Operating Cash Flow
Although operating cash flow was strong at about $8.9 million in FY2025 reflecting healthy business cash generation, net income was negative approximately -$529K for the year [F1]. This discrepancy results mainly from non-cash expenses such as stock-based compensation tied to deferred stock awards granted since suspension of long-term incentive plans in 2020 [S8][S23]. Such accounting timing differences cause net losses even when core operations generate positive cash flows.
This highlights an earnings quality consideration where accounting recognition temporarily masks underlying cash strength without signaling fundamental operational weakness.
Dividend Policy and Shareholder Returns
Canterbury Park Holding Corp has consistently returned capital via dividends totaling around $1.43 million annually most recently without meaningful share repurchases reported recently [F1][S14]. Dividends have shown slight increases aligned with operating stability despite earnings volatility—demonstrating commitment to shareholder returns balanced against liquidity preservation.
Outlook: Key Metrics To Monitor Going Forward
Key indicators influencing Canterbury Park’s outlook include recovery trends in casino patronage reflected by improved hold percentages and customer volumes post any competitive or regulatory shifts. Monitoring EBITDA margins will clarify if cost controls offset top-line pressures.
Capital expenditures focused on technology or facility upgrades warrant attention given their role in enhancing customer experience alongside free cash flow impacts. Regulatory developments affecting licensing or caps remain critical external variables shaping operational latitude.
Leverage ratios relative to credit covenant thresholds will provide early insight into balance sheet flexibility while changes in intersegment revenue flows may reveal evolving operational synergies.
Disclaimer: Analysis is based solely on publicly available financial disclosures as of March 10, 2026.
Disclaimer: This is research-only, informational analysis and not investment advice. It may include AI-generated interpretation and general industry context. Always verify important details using primary sources.
Comments