
Monolithic Power Systems’ Financial Performance and Innovation Edge in Semiconductor Power Solutions
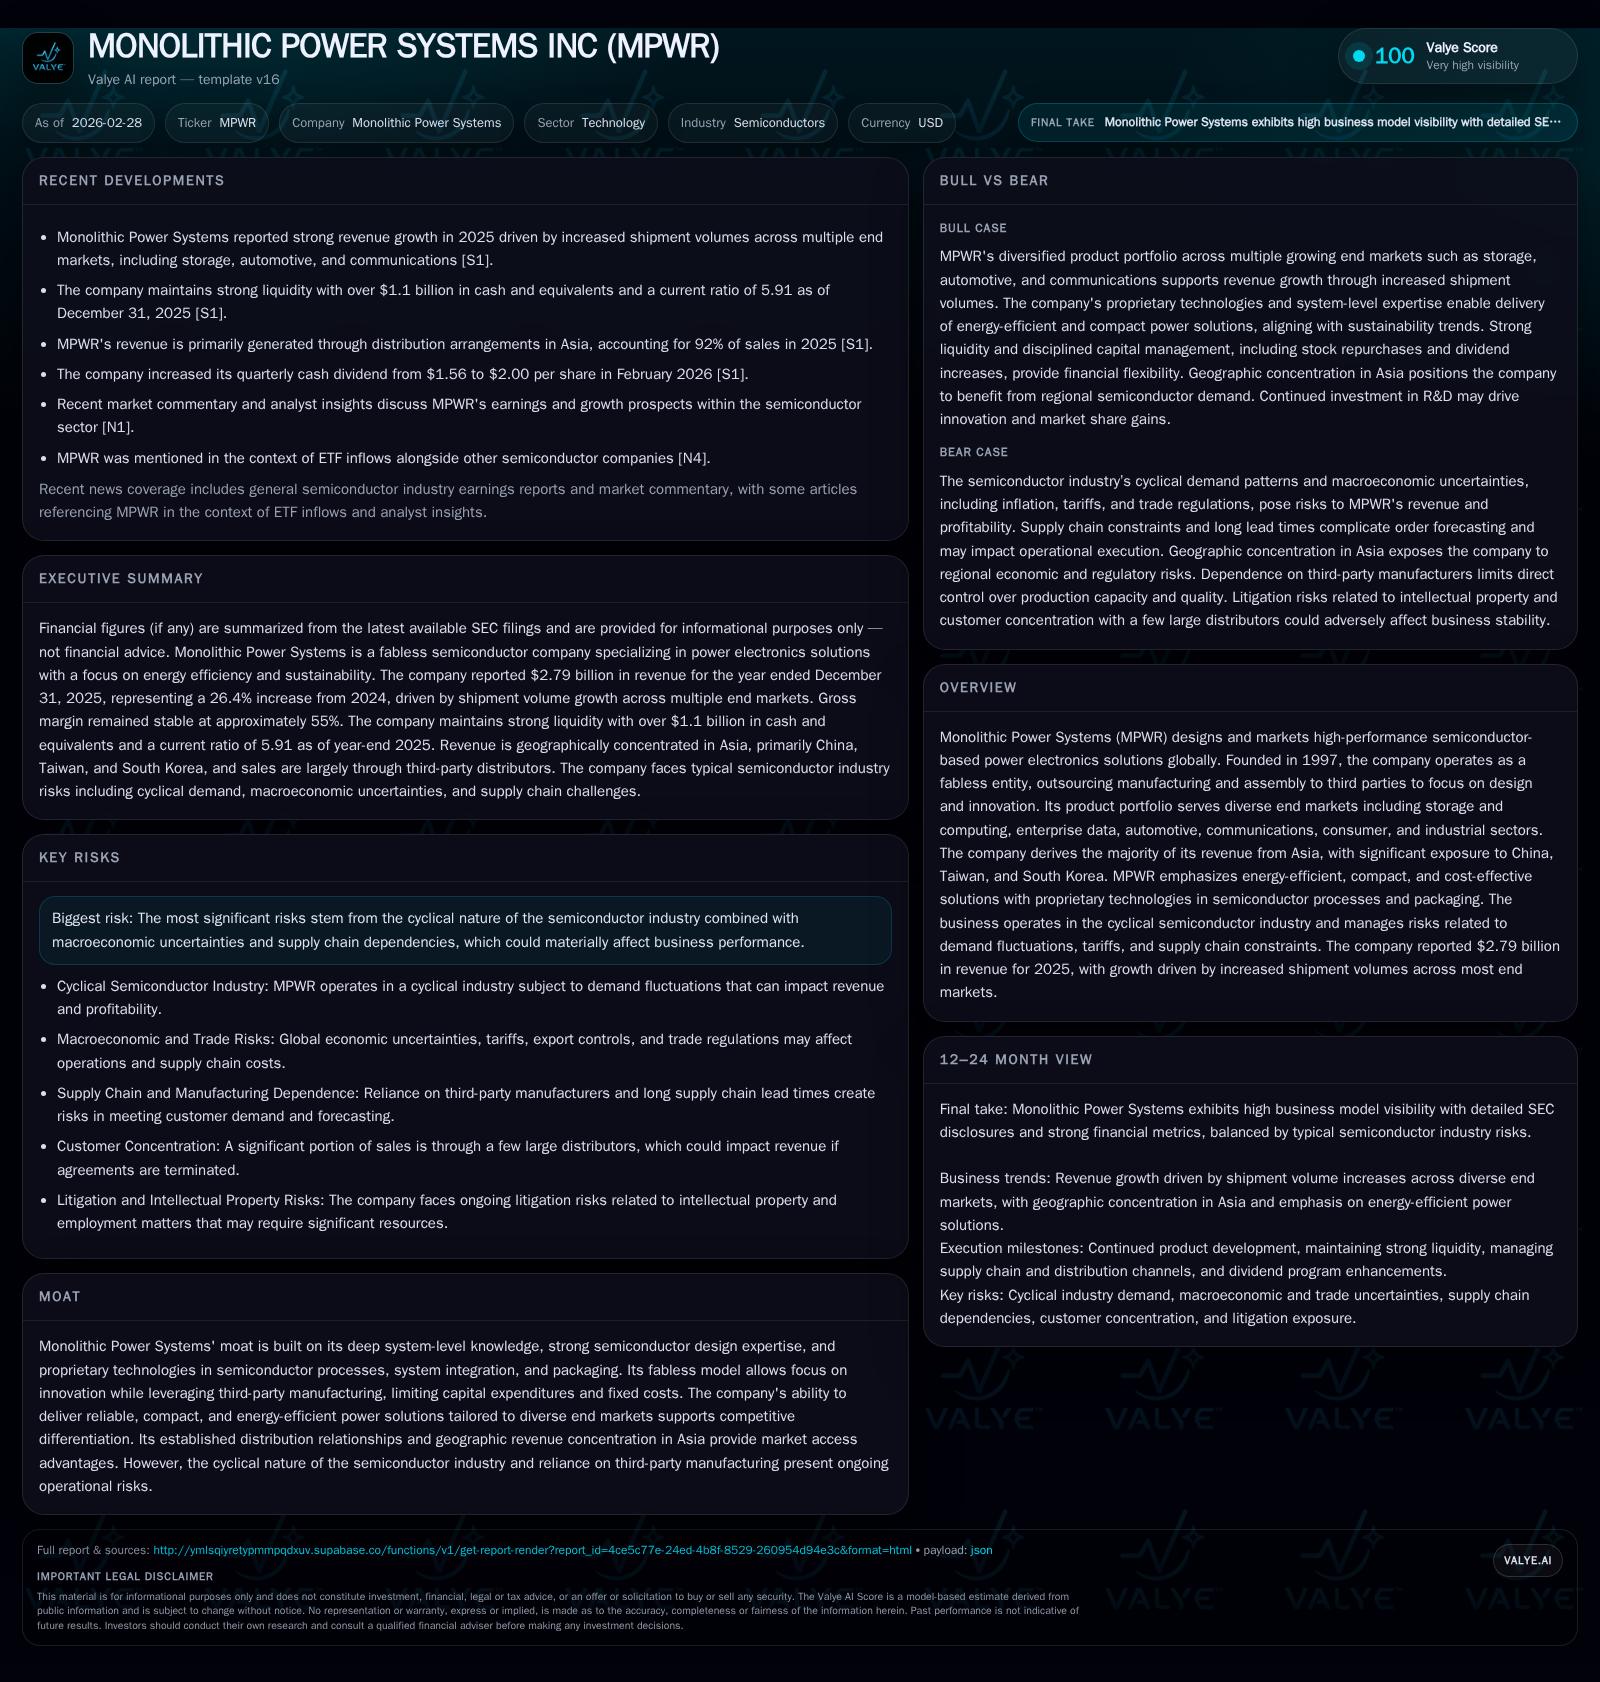
MPWR leverages its fabless model and proprietary design capabilities to sustain revenue growth and profitability amid semiconductor cyclicality.
Monolithic Power Systems (MPWR) has exhibited a robust growth trajectory in revenue and operating income over recent years, underpinned by its strategic fabless manufacturing model and specialized semiconductor power solutions. The company’s concentrated Asian sales footprint, particularly in China, Taiwan, and South Korea, aligns with diverse end markets such as automotive and storage. Capital allocation emphasizes R&D investment for innovation alongside disciplined dividends and restrained share buybacks. Despite inherent cyclicality and geopolitical risks linked to third-party fabs and trade sensitivities, MPWR maintains healthy profitability margins, strong cash flow generation, and effective risk management protocols.
Historic Revenue Expansion and Operating Income Growth: Drivers Behind the Numbers
Monolithic Power Systems (MPWR) has demonstrated a consistent upward trajectory in financial performance over the past several years. From $1.821 billion in revenue in FY2023, the company expanded top-line sales to approximately $2.21 billion in FY2024, followed by a notable acceleration to $2.79 billion in FY2025 — reflecting a year-over-year increase of roughly 17.9% for the latest fiscal year [F1]. This growth has been propelled primarily by increased shipment volumes across multiple end markets rather than straightforward pricing gains.
Operating income exhibits an even more pronounced improvement: rising from about $481.7 million in FY2023 to $539.4 million in FY2024, then sharply climbing to $728.6 million in FY2025—up 35.1% from the prior year [F1]. This operating leverage highlights effective cost controls despite rising expenses such as warranty accruals impacting gross margin slightly.
Historical performance (annual)
| FY | Net ($mm) | CFO ($mm) | OpInc ($mm) | Capex ($mm) | Net YoY |
|---|---|---|---|---|---|
| 2025 | 621 | 838 | 729 | 172 | -65.2% |
| 2024 | 1787 | 788 | 539 | 146 | +318.1% |
| 2023 | 427 | 638 | 482 | 58 | -2.4% |
| 2022 | 438 | 247 | 527 | 59 |
Source: SEC companyfacts cache [F1].
Capital returns and efficiency (annual)
| FY | Div ($mm) | Buybacks ($mm) | FCF ($mm) |
|---|---|---|---|
| 2025 | 285 | 7 | 666 |
| 2024 | 241 | 636 | 642 |
| 2023 | 186 | 4 | 581 |
| 2022 | 138 | 188 |
Source: SEC companyfacts cache [F1].
Net income figures require nuanced interpretation; while absolute net income jumped dramatically in FY2024 compared to FY2023 ($1.79B versus $427M), this spike appears influenced by one-time or non-core items referenced only broadly [F1]. Consequently, net income declined significantly from FY2024 to FY2025 despite rising operating profits.
Regional Sales Concentration and End Market Diversification
MPWR’s geographic exposure is heavily skewed toward Asia, which accounted for approximately 87%, 94%, and 92% of total revenues for fiscal years 2023 through 2025 respectively [S4][S12]. China alone represented roughly $1.54 billion or about 55% of the company’s total revenue for the year ended December 31, 2025 [S4]. Other significant Asian markets include Taiwan ($550 million) and South Korea ($253 million) [S4], illustrating a footprint aligned with major technology manufacturing hubs.
Revenue generation predominantly occurs through third-party distributors who handle more than 85% of MPWR’s product sales [S4][S5]. The three largest distributors each contributed at least between ~10%-26% of total revenue across recent years [S5], emphasizing distribution channel importance.
Redistribution through these intermediaries provides both opportunity and risk—the ability to rapidly reach diverse customers but also susceptibility to distributor performance fluctuations or contract terminations. Management expresses confidence that alternatives exist if these relationships change but acknowledges potential short-term disruptions [S5].
End markets served include storage and computing, automotive electronics, communications infrastructure, consumer devices, enterprise data centers, and industrial applications [S11][S12]. Notably, automotive revenues surged by over +43% year-over-year into FY2025 driven by increased demand for integrated power solutions supporting advanced driver assistance systems (ADAS) and infotainment platforms [S10]. Storage & computing also showed strong growth of approximately +46%, linked to memory modules, graphics cards, notebooks, etc., reflecting end-market diversification that cushions against single-market downturns [S10].
Innovative Product Design & Proprietary Technologies Fueling Competitive Moat
Distinctive among fabless semiconductor firms is MPWR's focus on system-level integration combined with proprietary semiconductor process technologies and wafer-level packaging innovations [S1]. This approach facilitates highly compact monolithic power electronics solutions tailored for energy efficiency—a critical differentiator affecting power density and heat dissipation important across demanding applications like automotive ADAS.
The company's operational strategy exploits its fabless model not only as a capital expenditure reduction tactic but as an enabler of nimble innovation centered on design excellence rather than fixed manufacturing infrastructure investment [S1]. This frees resources toward R&D efforts that advance performance benchmarks around efficiency and integration.
These capabilities underpin MPWR’s competitive positioning amidst louder industry narratives dominated by high-performance ASICs or discrete power devices; instead MPWR blends specialized semiconductor packaging expertise with deep domain knowledge across multiple complex end-markets requiring bespoke power management solutions.
Macroeconomic and Industry Constraints Impacting Growth Trajectory
Semiconductor sector cyclicality poses ongoing headwinds stemming from fluctuating consumer demand patterns coupled with macroeconomic pressures including inflationary costs and variable currency exchange rates [S1][S9]. Furthermore, uncertainties related to tariffs, export regulations, and geopolitical dynamics particularly affect MPWR due to its heavy reliance on Asian-based manufacturing partners ([S1],[S9]).
Despite these risks, MPWR’s targeted focus on higher-resilience markets specializing in energy-efficient semiconductor power solutions offers above-average stability relative to traditional commodity semiconductor segments where inventory corrections tend to be more severe [S1]. Product breadth spanning automotive safety systems plus growing cloud datacenter enterprises may offer some insulation against demand shocks experienced elsewhere in consumer chips.
Management remains committed to proactive tariff compliance plans along with supply-chain resiliency measures designed to minimize sudden impacts from trade-related disruptions while continuing close monitoring of export control landscape shifts [S1][S9].
Capital Deployment Priorities: R&D, Capex, and Shareholder Returns Analysis
Investment philosophy highlights sustained R&D spend driving innovation alongside incremental capital expenditures primarily assigned toward expanding production support capabilities rather than direct fabrication assets due to fabless status [F1][S7]. In fiscal year 2025 alone R&D expenses reached approximately $382 million or about 13.7% of total revenue—indicating strong commitment toward engineering talent retention, product development venues, prototyping labs, test validation setups as well as emerging technology exploration [F1][S7][S29]. This level marks a modest decline from prior-year R&D intensity proportionally given stronger top-line expansion but reflects scale efficiencies.
Capital expenditures grew by roughly 17.7% year-over-year amounting to $172 million aligned with scaling assembly/test collaborations plus facility enhancements essential for future growth phases [F1][S7].
On shareholder returns front: dividends declared rose by about 18% reaching near $285 million paid during FY2025 with dividend per share raised accordingly—a sign of steady earnings distribution policy coupled with confidence over mid-term cash flow sustainability [F1][S8][S16]. Meanwhile buybacks drastically slowed post a heavy repurchase program execution across previous periods—with just $6.6 million spent on repurchases compared to hundreds of millions earlier—signaling tactical capital preservation amid uncertain macro environment yet keeping open future return flexibility options [F1][S8].
Profitability Metrics in Context: Margins, ROE, and Operating Cash Flow Trends
Gross margins have remained relatively stable around 55%, modestly impacted by elevated warranty costs which increased as a component of cost of revenue but partially offset by lower inventory write-downs [F1][S7][S13]. Warranty provisions stood near $10 million at year-end—still modest relative to scale but one element stressing component reliability maintenance efforts needed for high-quality semiconductor design regimes.
ROE approximates 17.6% utilizing reported net income vis-à-vis shareholders' equity balance—indicative of effective use of invested capital given substantial retained earnings accumulation supporting organic growth funding without excessive leverage reliance [F1]. Operating cash flow consistently improved reaching $838 million in FY2025 (+6.3%) underpinning strong internal liquidity generation necessary for strategic reinvestments while preserving balance sheet flexibility [F1][S7]. Free cash flow likewise remains robust at roughly $666 million when deducting capex.
Such operating leverage metrics suggest scalable business fundamentals capable of mounting profitable volume expansions despite semi-industry inherent cyclicality hazards.
What to Watch: Orders, Supply Chain Lead Times, and Distribution Dynamics (Analysis)
Order intake forecasting persists as challenging due to customers’ flexible cancellation rights limiting visibility several quarters ahead coupled with typical supply chain lead times spanning 16-26 weeks—reflective of extended assembly/test cycle durations customary for sophisticated semiconductor products requiring multi-stage quality validations [S1]. Distribution partners remain critical nodes modulating both demand signals received upstream as well as delivery fulfillment smoothness downstream [S4][S5].
Market watchers should monitor indicators such as distributor inventory levels relative to shipment cadence plus reported customer backlog status where available—itself often obscured due to confidentiality—to better gauge near-term momentum shifts within end-markets like automotive or cloud infrastructure awaiting next-gen chip deployments.
Risk Management in a Fabless Model: Manufacturing and Geopolitical Exposures (Analysis)
The company's reliance on third-party foundries entails exposure not only operationally through supply chain continuity risks but strategically tied to geopolitical tensions concentrating facilities predominantly within East Asia—China especially constituting majority revenue source locations coupled with Taiwanese manufacturers vital for assembly/testing stages [S1][S9][S4].
MPWR mitigates these risks via diversified sourcing agreements complemented by maintaining substantial flexibility within its distributor ecosystem allowing quick customer servicing pivots if needed & developing contingency stocks where practical while adhering strictly to international trade regulations compliance frameworks stipulated by U.S., China and allied governments.
This risk mitigation is integral considering recent escalations surrounding trade policy uncertainties impacting semiconductor supply chains worldwide though no immediate material event has occurred impairing MPWR's operations thus far [S9]. Nonetheless ongoing vigilance remains crucial given rapid geopolitical developments possible within region.
Disclaimer: This analysis is based on publicly available information including SEC filings up to February 28, 2026 ([F1], [S#]) and reported news items ([N#]). It does not constitute investment advice or recommendations but aims solely at providing an informed overview of Monolithic Power Systems Inc.’s financial profile and industry context.
Disclaimer: This is research-only, informational analysis and not investment advice. It may include AI-generated interpretation and general industry context. Always verify important details using primary sources.
Comments