
Marine Products Corp's Earnings Retreat and Capital Discipline Highlight 2025
In 2025, Marine Products experienced a notable earnings contraction despite revenue growth, emphasizing its focus on capital discipline amid operational challenges.
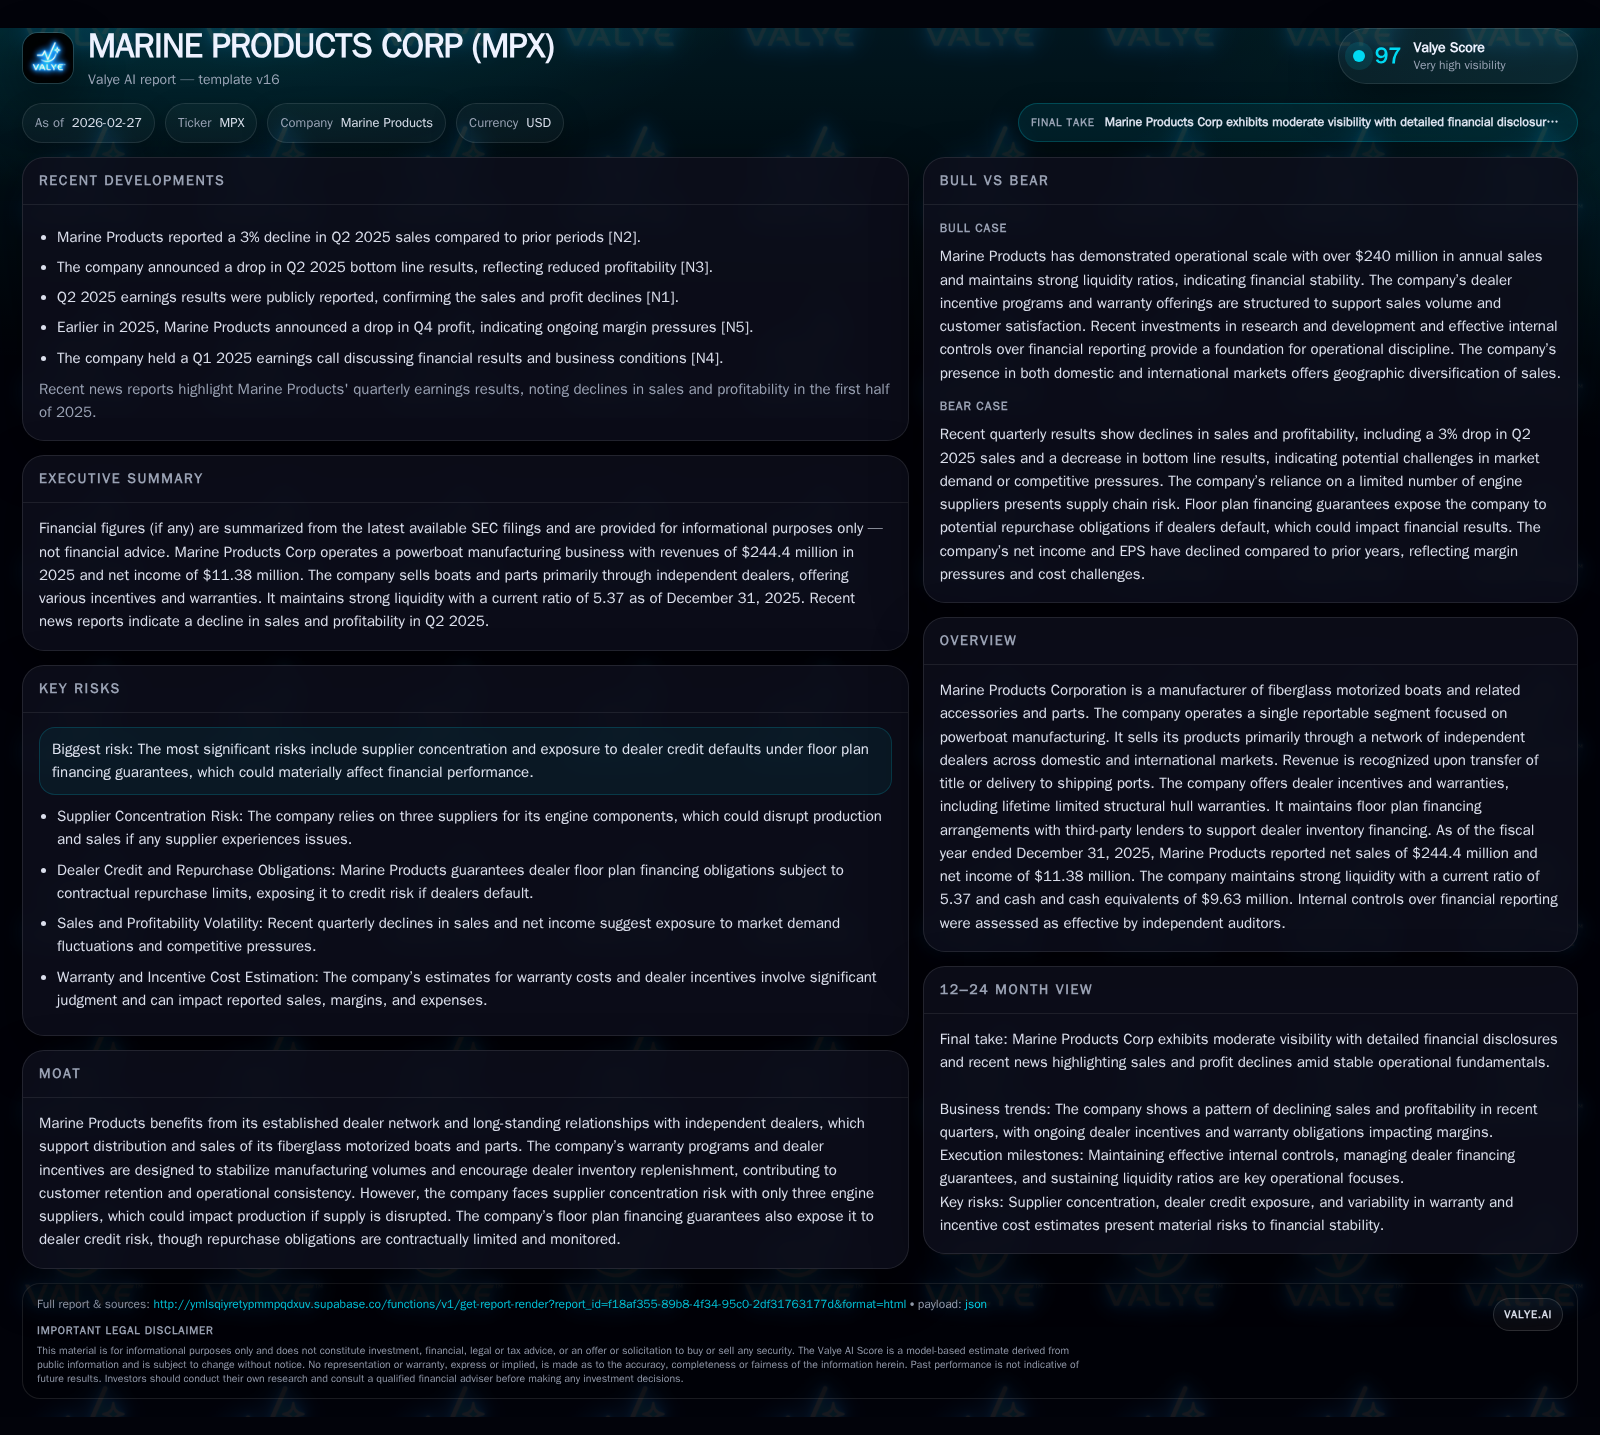
Marine Products Corporation reported a 10.8% revenue increase in fiscal year 2025, reaching approximately $244 million. However, operating income declined by 23.2% to $14.0 million, and net income fell by 36.2% to $11.4 million, reflecting margin pressures. The company maintained disciplined capital allocation with dividend payments of $19.6 million and modest share repurchases near $1 million, alongside a sharp reduction in capital expenditures to $1.54 million. Strong liquidity with a current ratio above 5 and solid cash reserves provide financial flexibility amid risks from supplier concentration and floor plan financing guarantees capped contractually. Pending merger-related litigation introduces legal uncertainties but is not expected to materially impact financial condition.
Historical Financial Performance
Marine Products Corporation has exhibited steady revenue growth over recent years, increasing from approximately $171 million in 2014 to around $244 million in fiscal year 2025 [F1]. The latest year marked a revenue increase of 10.8%, underscoring sustained demand for its fiberglass motorized boats.
Despite top-line growth, operating income declined by 23.2% year-over-year to $14 million, indicating margin pressures potentially due to increased costs or pricing dynamics [F1]. Net income similarly decreased by 36.2%, reaching $11.38 million, highlighting profit challenges beyond revenue expansion.
Operating cash flow fell by 44.2% to about $16.46 million despite higher revenues, suggesting working capital or expense timing impacts on cash conversion efficiency [F1]. Concurrently, capital expenditures dropped sharply by 66.5% to approximately $1.54 million, reflecting cautious investment spending.
Historical performance (annual)
| FY | Net ($mm) | CFO ($mm) | OpInc ($mm) | Capex ($mm) | Net YoY |
|---|---|---|---|---|---|
| 2025 | 11 | 16 | 14 | 2 | -36.2% |
| 2024 | 18 | 30 | 18 | 5 | -57.2% |
| 2023 | 42 | 57 | 49 | 10 | +3.3% |
| 2022 | 40 | 49 | 52 | 3 |
Source: SEC companyfacts cache [F1].
Capital returns and efficiency (annual)
| FY | Div ($mm) | Buybacks ($) | FCF ($mm) |
|---|---|---|---|
| 2025 | 20 | 1055000 | 15 |
| 2024 | 44 | 933000 | 25 |
| 2023 | 19 | 910000 | 47 |
| 2022 | 17 | 702000 | 47 |
Source: SEC companyfacts cache [F1].
Data sourced from company filings and SEC disclosures [F1]
Dealer Network and Floor Plan Financing Exposure
Marine Products distributes its boats primarily through an extensive network of independent dealers across domestic and international markets [S28]. To support dealer inventory acquisition, the company participates in floor plan financing arrangements guaranteed by Marine Products itself; these agreements obligate the company to repurchase repossessed boats under dealer defaults within contractual limits [S1][S11][S13].
As of December 31, 2025, aggregate repurchase obligations under these guarantees totaled approximately $29.6 million but have not resulted in material repurchases recently, indicating controlled credit risk management [S11][S13]. This dealer financing structure supports volume stability but requires ongoing monitoring due to inherent contingent liabilities.
Supplier Concentration Risks
A significant operational risk stems from reliance on three engine suppliers for boat manufacturing [S16][S26]. Such supplier concentration heightens exposure to supply chain disruptions which could adversely affect production schedules and sales fulfillment.
The filings do not disclose specific diversification strategies; however, this remains a key risk factor necessitating attention given the criticality of engine components in product delivery cycles.
Capital Allocation: Dividends, Buybacks, and Investment
Marine Products maintained disciplined capital allocation in fiscal year 2025 amidst earnings pressure [F1][S4][S8][S10][S17][S21][S29]. The company paid dividends totaling approximately $19.6 million while executing modest share repurchases near $1 million.
Capital expenditures were restrained at about $1.54 million, down significantly from prior years’ levels reflecting prudent cash management aligned with reduced free cash flow.
Free cash flow—operating cash flow less capital expenditures—was estimated around $14.9 million for the year, sufficient to cover dividends comfortably but lower than historical norms [F1]. Return on equity was approximately 9.1%, down from prior years but indicative of moderate profitability relative to equity base.
Liquidity Position and Financial Flexibility
Marine Products exhibits strong liquidity with current assets near $110.6 million against current liabilities around $20.6 million at December 31, 2025 — yielding a robust current ratio of approximately 5.37 [F1]. Cash and equivalents stood at roughly $9.63 million as of the most recent quarter available.
The company also maintains access to a revolving credit facility up to $20 million secured against company assets with favorable terms supporting liquidity needs [S5][S6][S7][S9].
Working capital management includes accounts receivable predominantly financed through floor plan arrangements carrying minimal loss allowances; inventory is managed at net realizable value thresholds maintaining balance sheet quality.
This liquidity buffer provides resilience against market cyclicality, supply disruptions, or contingencies related to pending merger litigation.
Legal Proceedings and Merger Considerations
Marine Products faces ongoing litigation related primarily to proposed mergers with MasterCraft Corporation including potential termination fees totaling $11.6 million under certain conditions [S1][S16].
Stockholder lawsuits challenging the mergers may delay completion but are not currently expected to materially affect the company's financial condition or operations based on management assessments [S3][S16].
Outlook Considerations
While explicit forward guidance is unavailable, key factors for investors include:
- Progress and resolution of merger-related matters including potential impact of litigation delays.
- Efforts toward supplier diversification or alternative sourcing arrangements mitigating concentration risks.
- Continued monitoring of dealer credit exposure associated with floor plan financing guarantees.
- Margin recovery initiatives via cost control or pricing adjustments critical for restoring profitability.
- Capital allocation balance between shareholder returns and reinvestment amid evolving market conditions.
Absent formal forecasts, stakeholders should track quarterly disclosures and external market dynamics influencing discretionary boating demand.
This analysis reflects information publicly available as of February 27, 2026 including SEC filings without speculative forecasts or investment recommendations.
Disclaimer: This is research-only, informational analysis and not investment advice. It may include AI-generated interpretation and general industry context. Always verify important details using primary sources.
Comments