
Everspin Technologies’ Revenue Expansion and Capital Discipline Define 2025 Performance
Everspin’s 2025 growth driven by MRAM product design wins contrasts with margin pressures and net income contraction amid strategic capital investments.
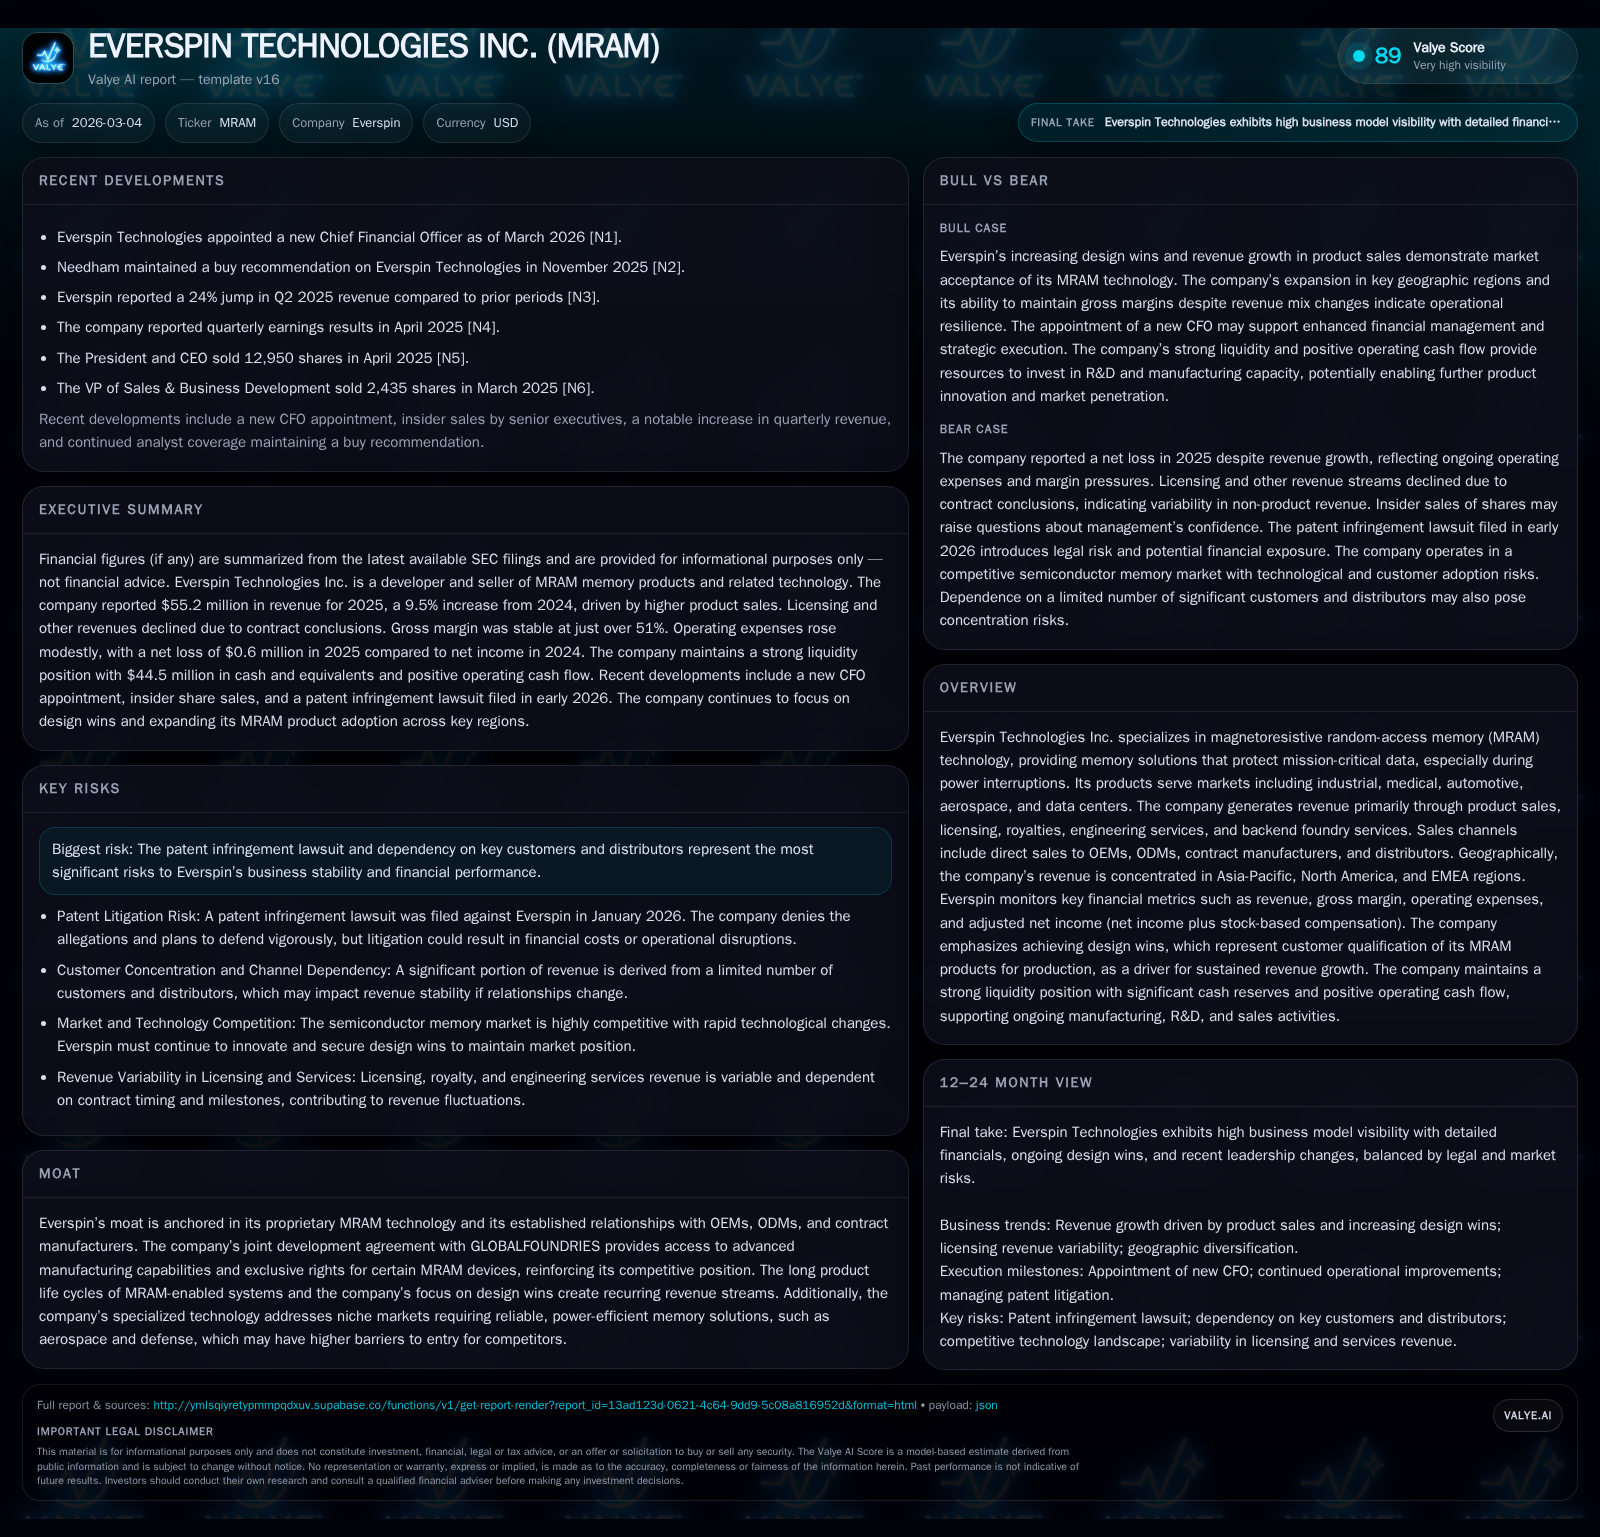
Everspin Technologies advanced its MRAM business in 2025 with a notable increase in product sales fueled by record design wins, pushing annual revenue to $55.2 million, a 9.5% rise year-over-year. Despite this top-line growth, gross margins compressed slightly due to a changing revenue mix and operational expenses edged higher. The company sustained positive operating cash flow and escalated capital expenditures, underscoring its commitment to manufacturing scale-up and R&D pipelines. Key risks include ongoing patent litigation and significant customer concentration, particularly in Asia-Pacific where most revenues accrue.
Growth Trajectory Supported by Surge in MRAM Design Wins
Everspin Technologies exhibited solid top-line growth in fiscal year 2025, with total revenues rising to $55.2 million from $50.4 million the previous year, marking a gain of 9.5% [F1][S4]. This increase was principally driven by product sales expanding by $6.1 million or 14.4%, propelled by a significant jump in MRAM design wins — an industry term denoting the qualification of Everspin’s memory solutions within customer products for production [S1]. Quarterly design wins climbed sequentially throughout 2025: from 44 in Q1 to an impressive peak of 85 in Q4 (compared to just 31 and 53 respectively during the same quarters last year), underscoring rising market acceptance and penetration into strategic OEMs [S1][S13]. Such design wins typically translate into recurring revenue given the lengthy lifecycles of embedded systems using MRAM.
Conversely, licensing-related revenues encompassing royalties, patent incomes, engineering services, and other contractual fees dropped by around $1.3 million (-15.7%), chiefly attributable to the conclusion of contracts like those developing reliability models for radiation-hardened toggle MRAM [S4][S6]. This pivot reflects Everspin’s deliberate strategy focusing on volume-based product deployments versus variable licensing streams.
Shifting Revenue Composition Reflects Strategic Product Focus
The firm’s revenue mix evolved noticeably as product sales constituted about 87% of total revenue in 2025, up from roughly 84% the prior year [S4]. Licensing and royalty streams shrank both in absolute dollar terms and as a percentage of revenue from approximately 16% down to around 13%. The dip stems from the completion of specific strategic developmental arrangements that had previously contributed disproportionately to non-product income [S6]. This shift aligns Everspin with broader industry trends favoring tangible MRAM device adoption over one-off IP monetization.
In addition, engineering services revenue rose considerably within the remainder segment, supported by ongoing customized developments leveraging Everspin’s IP portfolio [S7]. Overall, Everspin is cementing its identity as a technology supplier scaling mass production rather than predominantly contractual or licensing partner.
Efficiency Gains Amid Slight Margin Compression
Despite growing revenues, gross margins reflected modest compression; reported gross margin retreated slightly to 51.2% from the prior year’s level of 51.8% due primarily to shifts toward higher product volume sales which carry comparatively thinner margins than licensing fees [S5]. Cost of product sales increased proportionally by around $3.1 million (13.7%), consistent with manufacturing scale-up and higher unit volumes.
Operational discipline is evident though: R&D expense rose moderately by just under three percent ($0.4 million), maintaining a steady investment posture focused on developing extended Serial Peripheral Interface (xSPI) STT-MRAM solutions targeting multiple market verticals including automotive and aerospace reliability enhancements [S16][S18]. General and administrative outlays increased marginally (+2.9%) mainly owing to one-time professional fees [S16], while sales and marketing posted sharper gains (+13.4%), reflecting heightened compensation costs indicative of incremental efforts around design win conversions and channel expansion [S16].
Geographic Revenue Concentration and Customer Dependencies
Geographically, Asia-Pacific represents the bulk of Everspin’s business footprint with approximately $34.5 million or roughly two-thirds (62.5%) of annual revenues generated there in fiscal year '25, followed distantly by North America (~$10.9 million) and EMEA at just under $9.8 million [S4][S10]. Within APAC, Singapore emerged as a notable growth locus generating over $13 million annually — nearly quadruple its prior year contribution — signaling successful regional penetration via both direct OEM engagements and distribution channels [S26].
Customer concentration remains a material risk factor: one key customer accounted for nearly one-quarter (25%) of total revenues while representing over half (57%) of accounts receivable balances at year-end, underscoring potential liquidity exposure should demand or payment terms fluctuate unfavorably [S8]. This high dependency metric is partly mitigated by diversified end markets across industrial automation, data centers, medical devices, automotive electronics, aerospace applications where product lifecycles yield lower volatility once adopted.
Innovation Pipeline and Future Growth Constraints
Everspin’s future growth remains tightly linked to continued success securing design wins that embed its STT-MRAM technology across new platforms [S1][S13]. The joint development agreement with GLOBALFOUNDRIES continues providing critical access to advanced semiconductor manufacturing nodes including exclusive manufacturing rights for certain device families through key phases post-qualification — fortifying Everspin’s competitive moat through manufacturing capacity barriers and IP collaborations that deter entry [S11][S19].
However, persistent patent infringement litigation poses downside operational risks that could divert management attention or incur material costs despite current mitigation strategies monitored at board level via cybersecurity risk oversight frameworks [S1][S22]. Additionally, customer concentration restricts revenue volatility absorption capability — any significant loss or shift in buying patterns threatens near-term performance stability.
Capital Deployment: R&D, Capex, and Shareholder Returns
Reflecting an aggressive buildout agenda aligned with sustaining technology leadership and scaling throughput capacity, capital expenditures more than doubled year-over-year (+124%) reaching nearly $6.8 million spent primarily on manufacturing equipment purchases alongside relevant intangible assets such as internal-use software tied closely to next-gen xSPI product suite development initiatives [F1][S5][S15][S20].
Research & development commitments held steady at about $14 million but continued forming a critical lever underpinning innovation pipelines extending beyond core Toggle/STT-MRAM families into higher performance configurations tailored for stringent aerospace/defense standards [S16][S18].
Cash flow generation remains healthy despite GAAP losses: operating cash flow soared over +40% YoY reaching approximately $10 million bolstered by working capital management including accounts receivable reductions; free cash flow after accounting for capex was positive at roughly $3.1 million giving financial flexibility for reinvestment or opportunistic allocations [F1][S21]. No dividends or share repurchases were recorded during the period reflecting retained earnings usage focused on reinvestment rather than direct shareholder distributions at this stage [S29].
Risk Considerations: Litigation and Customer Concentration
Intellectual property lawsuits periodically impact Everspin reflecting industry-wide challenges defending niche semiconductor innovations against infringement claims or counterclaims; while currently not expected to materially impact financials, pending legal actions require ongoing monitoring as they could substantially affect earnings or cash flows if adverse rulings materialize [S22][N1].
Furthermore, dependence on major customers warrants caution: top clients represent concentrated sources exceeding regulatory thresholds for reporting purposes (>10%), magnifying concerns over payment timing or contract term renewals that could impair liquidity profiles given sizeable trade receivables tied specifically to these relationships [S8]. Governance structures emphasize robust cybersecurity risk management involving senior leadership oversight yet cannot fully insulate against evolving external threats that intersect operational continuity.
Key Metrics Snapshot: Operational and Financial Trends to Watch
The table below distills key financial results highlighting steady revenue progression juxtaposed against fluctuating profitability metrics influenced by ongoing investment cycles:
Historical performance (annual)
| FY | Net ($mm) | CFO ($mm) | OpInc ($mm) | Capex ($mm) | Net YoY |
|---|---|---|---|---|---|
| 2025 | -1 | 10 | -7 | 7 | -175.0% |
| 2024 | 1 | 7 | -7 | 3 | -91.4% |
| 2023 | 9 | 13 | 6 | 1 | +47.7% |
| 2022 | 6 | 9 | 6 | 3 |
Source: SEC companyfacts cache [F1].
Capital returns and efficiency (annual)
| FY | FCF ($mm) | ROE% |
|---|---|---|
| 2025 | 3 | -0.9 |
| 2024 | 4 | 1.2 |
| 2023 | 12 | 16.8 |
| 2022 | 7 | 15.9 |
Source: SEC companyfacts cache [F1]. | Note: Net income shows volatility partly due to stock-based compensation expense adjustments while operating cash flow trend indicates improving cash profitability despite GAAP losses reported [F1].
This analysis synthesizes publicly filed company financials supported principally by their latest SEC Form-10K filings through December end-2025 alongside corroborative news releases while abstaining from forward-looking speculations absent explicit disclosures concerning guidance or milestone achievements not directly evidenced herein.
Disclaimer: This is research-only, informational analysis and not investment advice. It may include AI-generated interpretation and general industry context. Always verify important details using primary sources.
Comments