
MVB Financial Corp’s Earnings Volatility and Strategic Divestitures Impact Capital Efficiency
A regional bank leveraging Fintech niche services faces earnings challenges, regulatory risks, and evolving capital deployment choices.
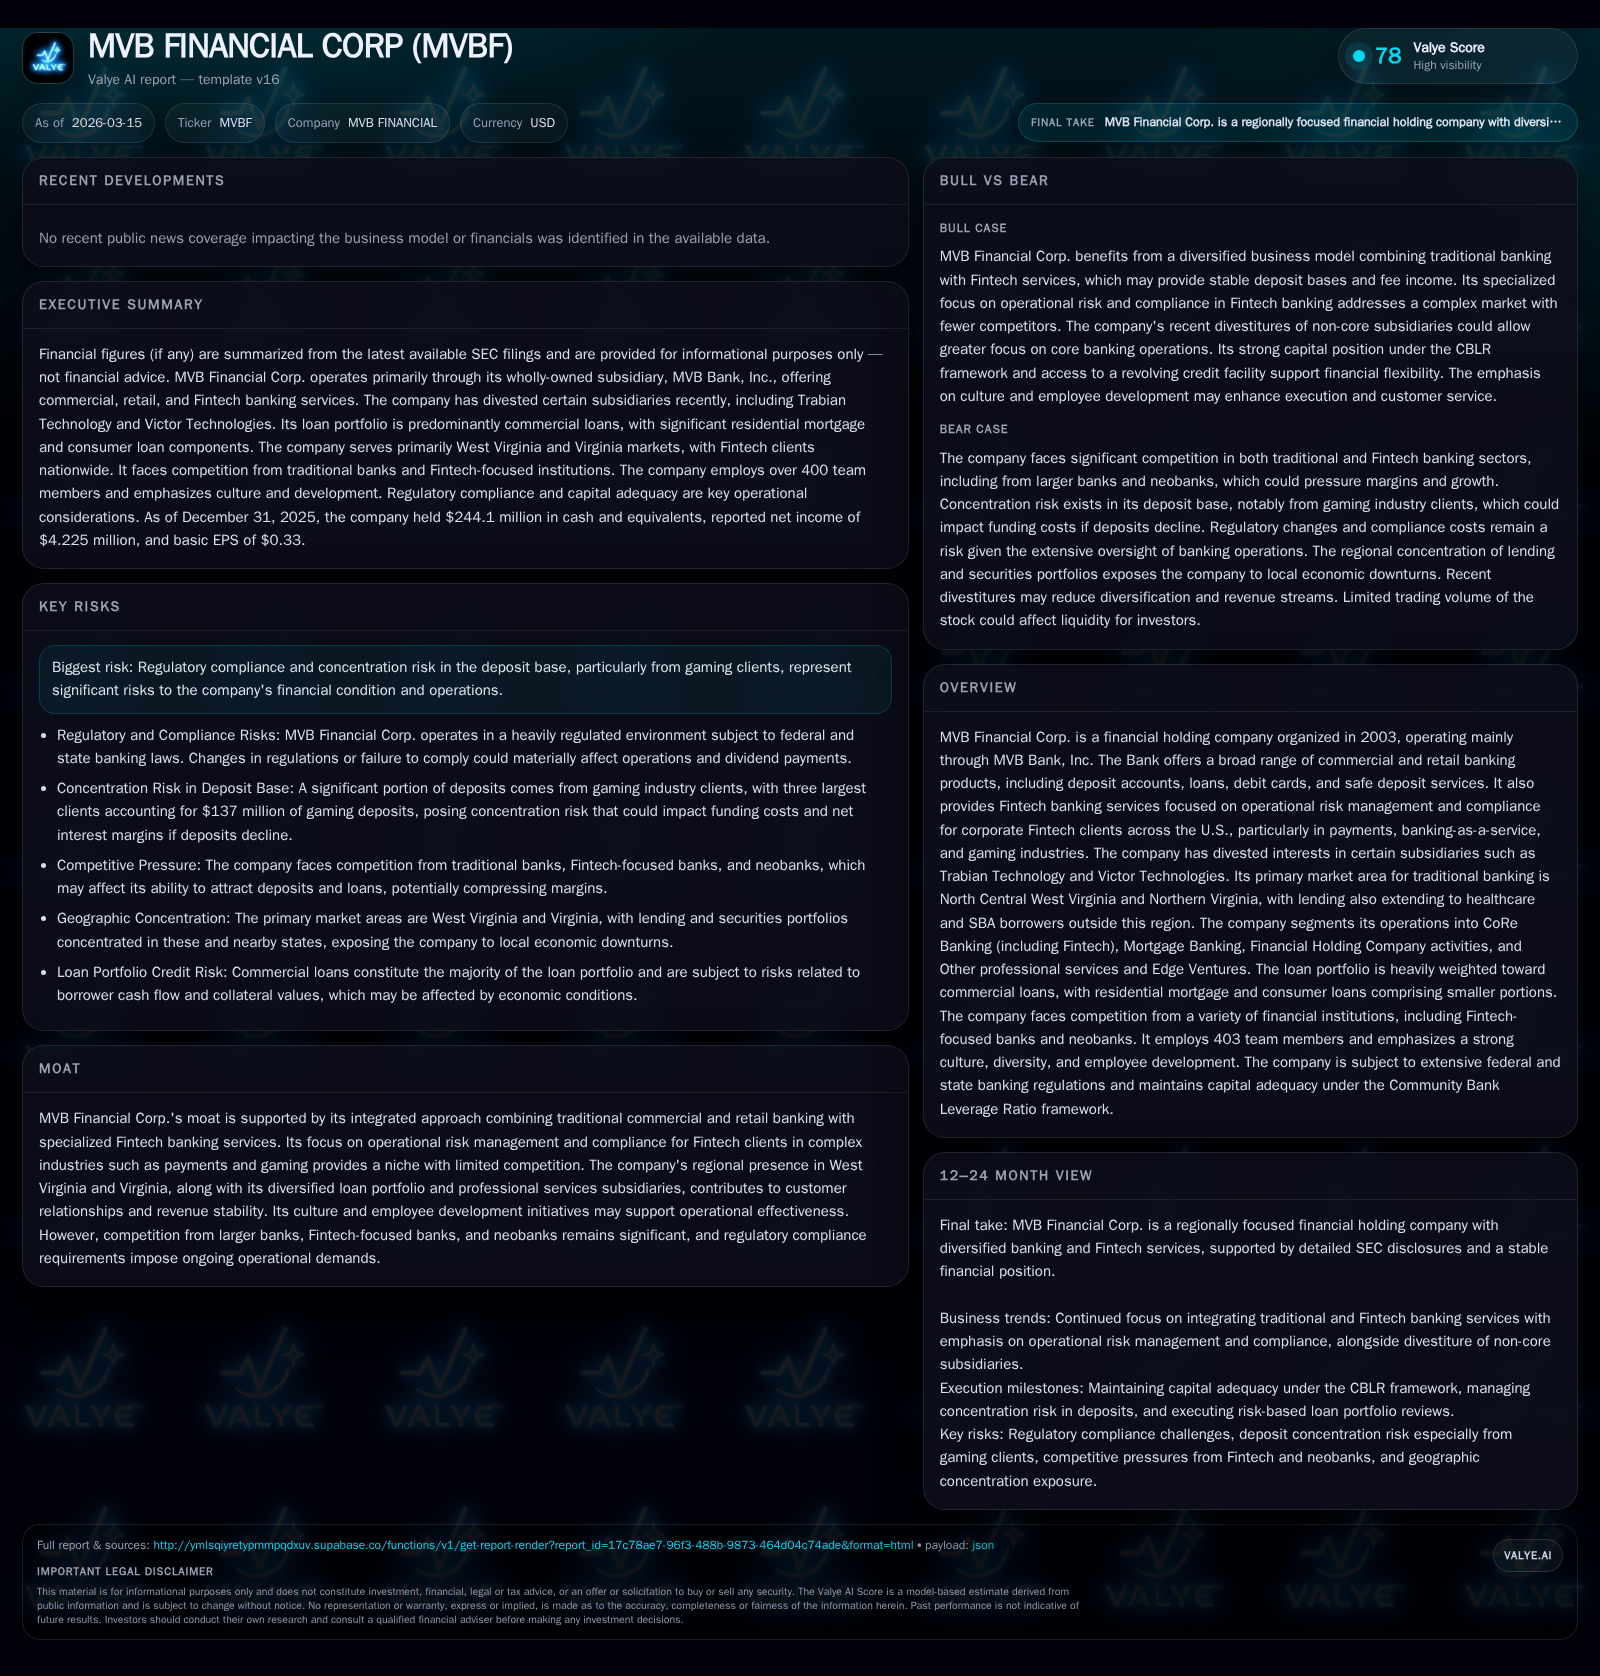
MVB Financial Corp., primarily operating through MVB Bank, integrates traditional commercial banking in West Virginia and Virginia with specialized Fintech banking services focused on complex regulatory compliance sectors. After solid growth from 2022 through 2024, the company experienced a sharp net income decline in 2025 alongside positive cash flow recovery, driven partly by strategic divestitures such as the sale of Victor Technologies yielding a one-time gain. Going forward, MVB's growth prospects hinge on expanding its Fintech clientele nationally and managing risks tied to deposit concentration and regulation. Capital returns remain active with stable dividends and resumed buybacks, although return on equity is compressed following earnings deterioration.
Company Overview
Founded in 2003, MVB Financial Corp operates primarily through its wholly owned subsidiary MVB Bank, Inc., centering operations mainly in the North Central West Virginia and Northern Virginia markets. Its business model blends traditional CoRe (Commercial and Retail) banking services—deposit accounts, commercial loans, mortgage lending—with Fintech banking offerings aimed at U.S. corporate clients who demand sophisticated operational risk management solutions amid complex regulatory regimes. These clients are especially drawn from payments processing, banking-as-a-service platforms, and the gaming industries where compliance intricacies limit traditional bank competition [S1][S19].
Beyond core banking, MVB deploys professional services via subsidiaries like Paladin Fraud, specializing in fraud detection for merchants and Fintech firms. Moreover, it has grown through selective venture investments but recently divested majority stakes held in entities such as Trabian Technology and Victor Technologies to focus resources more efficiently [S12][S24].
Historical Financial Performance
MVB’s financial trajectory has seen fluctuations emblematic of its mix between legacy community banking and emerging sector niches:
Historical performance (annual)
| FY | Net ($mm) | CFO ($mm) | Capex ($mm) | Net YoY |
|---|---|---|---|---|
| 2025 | 4 | 4 | 2 | -55.2% |
| 2024 | 9 | 0 | 2 | +19.3% |
| 2023 | 8 | 58 | 2 | +21.5% |
| 2022 | 7 | 65 | 3 |
Source: SEC companyfacts cache [F1].
Capital returns and efficiency (annual)
| FY | Div ($mm) | Buybacks ($mm) | FCF ($mm) |
|---|---|---|---|
| 2025 | 9 | 10 | 2 |
| 2024 | 9 | -2 | |
| 2023 | 9 | 56 | |
| 2022 | 8 | 0 | 62 |
Source: SEC companyfacts cache [F1].
Net income grew steadily from $6.51 million in FY2022 hitting a peak of $9.44 million in FY2024 before collapsing by over half to $4.23 million in FY2025 [F1]. This sharp contraction reflects elevated expenses related to inflationary pressures, interest rate environment changes affecting securities valuation negatively, and possible reduced demand or borrower repayment stress as outlined by management’s risk disclosures [S1].
Operating cash flow was volatile though improved markedly to $4 million positive in FY2025 after a steep dip into negative territory in FY2024; this turnaround indicates improvement in working capital management or realization of gains such as from asset sales [F1]. Capital expenditures remained moderate but rising slightly.
Dividends have been consistently paid at just above $8 million per year despite income fluctuations, highlighting management’s commitment to shareholder returns even under earnings pressure [F1]. Notably, share repurchases reinitiated in FY2025 at about $10 million following a pause since prior years underline a strategic return of capital when liquidity permitted.
Strategic Divestitures Influence Financials
The company executed key divestitures during the recent period: selling substantially all assets of Victor Technologies to Jack Henry & Associates yielded a $34.2 million pre-tax gain recorded in late FY2025 [S12]. Additionally, the sale of Trabian Technology shares completed earlier removed that business line from consolidation [S12]. These moves sharpened focus on core banking segments while injecting one-time profits that complicate year-over-year profitability comparisons.
Core Banking: Market & Loan Portfolio Composition
MVB’s bank operates seven full-service branches predominantly across West Virginia and Virginia – six branches in West Virginia and one in Northern Virginia [S22]. Its lending concentration historically skews toward commercial loans which constituted nearly three-quarters (72.9%) of the loan portfolio as of December 31, 2025 totaling approximately $1.71 billion [S4]. These loans span commercial & industrial lines, real estate acquisition & development financing including construction loans with attention to evaluated borrower cash flow capability.
Residential mortgage loans comprise roughly one-quarter of total loans at $609 million including home equity lines and construction mortgages; these are traditionally more secured by first liens supported by appraisals or title insurance as collateral quality checks are prudently undertaken [S9].
Consumer installment lending remains marginal at about $25 million or just over one percent of total loans indicating conservative exposure there [S21].
Portfolio risk is managed through multi-layered credit review processes internally complemented by third-party external reviews covering about one-third of commercial loan exposures annually emphasizing early detection of credit deterioration [S4].
Fintech Banking Niche
The firm’s Fintech division serves corporate clients nationwide focusing on sectors where risk profiles are operationally complex due to heightened regulatory oversight — payments providers, platforms offering banking as a service (BaaS), and gaming operators primarily [S19]. This specialization taps into an underserved market segment with barriers protecting against commoditized competition.
By thoroughly analyzing new products/services from operational/regulatory angles before onboarding clients, MVB aims to maintain prudent risk limits while generating low-cost deposits plus fee income streams that support stable revenue diversity outside its geographic core markets.
Regulatory Environment & Risks
Regulatory scrutiny around operational risk management burden is significant given the specialized nature of Fintech clients plus recent FDIC rulings post-2023 banking sector disruptions which increased oversight on uninsured deposit compositions [S1][S20]. Concentration risks—particularly deposit bases sourced from gaming clientele—pose liquidity vulnerability if client confidence wanes.
Moreover, elevated inflation influences noninterest expenses upward while potential interest rate hikes could impact securities portfolio valuations negatively; these macroeconomic variables add volatility to earnings outcomes [S1]. Environmental liability risks tied to commercial real estate lending necessitate ongoing assessment though are not presently material [S15][S24].
Capital allocation and Returns
Utilizing the Community Bank Leverage Ratio framework given assets under $10 billion (currently ~$3.3 billion), MVB maintains strong capital ratios with leverage at approximately 11.1% meeting 'well capitalized' status allowing flexibility for dividends/buybacks without heightened regulatory constraints [S14][F1].
Despite weak net income growth recently suppressing ROE — estimated around just above 1% for FY25 — equity balances have grown steadily implying retention of earnings over multiple years previously plus capital contributions bolstering balance sheet strength [F1].
Dividend continuity near $8.7 million annually reflects stable payout policies while resumption of share repurchases (~$10 million) signals a calibrated approach balancing reinvestment through organic growth alongside shareholder returns amid profitability pressures [F1].
What to Watch Forward (Analysis)
- Monitor expansion pace of Fintech customer base nationally since it represents a differentiated growth avenue mitigating geographic loan concentration exposure.
- Observe any shifts in deposit composition especially uninsured deposits which can trigger liquidity volatility amid adverse economic or sector-specific conditions.
- Future interest rate moves by Federal Reserve will impact margins unevenly given securities portfolio duration mismatch risk versus loan repricing timelines.
- Rising operating costs linked to inflation and compliance requirements may persistently weigh on net income unless revenue streams diversify or expense efficiencies improve.
- Regulatory developments targeting community banks’ capital frameworks could adjust calculation norms affecting MVB’s capital strategy.
- Potential for further strategic divestitures or acquisitions aligned with core competencies could reshape operating segment footprint.
- Close watch on loan portfolio quality metrics amidst economic cycles particularly real estate-related segments vital given concentration profile.
Conclusion
MVB Financial Corp balances community-centric traditional banking services with a cutting-edge niche servicing highly regulated Fintech sectors – an integrated model conferring some competitive moat yet exposing it to regulatory complexity and concentration vulnerabilities unique among regional banks. The company’s recent large-scale divestitures reflect strategic refocusing efforts that produce one-off profit boosts but challenge sustainable earnings normalization as seen in FY25 results. Capital levels remain robust facilitating measured shareholder returns despite depressed profitability driven by macroeconomic headwinds. Success depends heavily on managing balance sheet composition prudently while scaling specialized Fintech relationships across broader U.S. markets without diluting risk discipline. As industry dynamics evolve alongside ongoing inflationary pressures plus regulatory shifts post-2023 banking turmoil, MVB must navigate corrective actions judiciously to stabilize earnings quality while preserving balance sheet strength.
Disclaimer: This analysis presents an information-based assessment solely utilizing publicly available data up to March 15, 2026 including SEC filings and recent news coverage; it does not constitute investment advice or endorsements.
Disclaimer: This is research-only, informational analysis and not investment advice. It may include AI-generated interpretation and general industry context. Always verify important details using primary sources.
Comments