
OceanFirst Financial's Strategic Merger and Profitability Shift in 2025
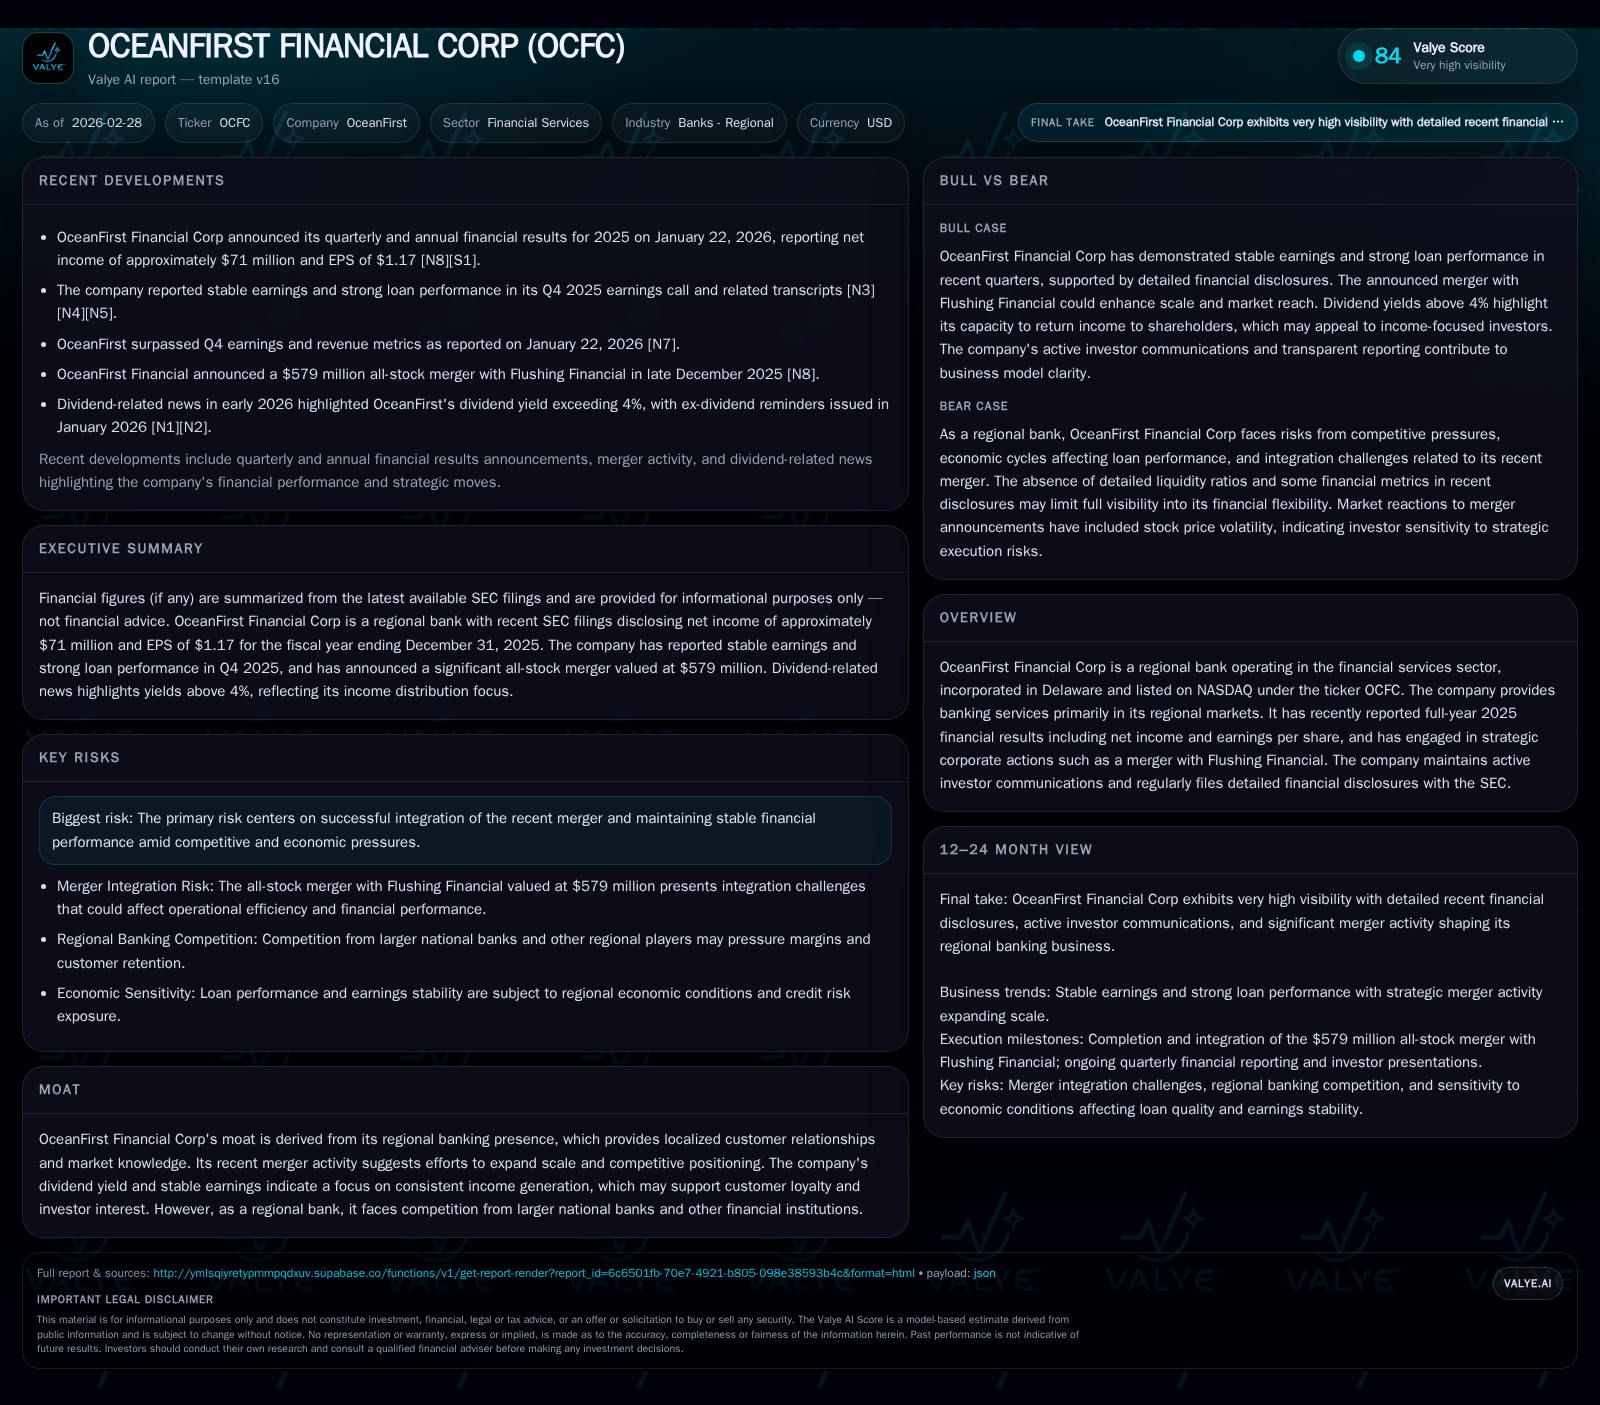
OceanFirst Financial Corp’s 2025 results reflect merger-driven growth ambitions tempered by a notable decline in earnings and adjusted capital deployment strategies.
In 2025, OceanFirst Financial Corp navigated a complex juncture marked by the integration of Flushing Financial and a near 30% net income contraction from the prior year. While top-line growth drivers were challenged by margin pressures and one-time costs, the company maintained stable capital expenditures and continued shareholder returns via dividends and selective buybacks. The strategic merger broadens its regional footprint but poses integration risks that could influence near-term profitability. Monitoring credit trends, margin stabilization, and merger milestones will be crucial as OceanFirst seeks to leverage scale amid persistent competitive headwinds in regional banking.
Financial Performance Trajectory: Highlights from FY2019 to FY2025
OceanFirst Financial Corp's trajectory over recent years lays the foundation for understanding the financial pivot observed in 2025. The company reported net income of $70.98 million for fiscal year 2025, down sharply from $100.07 million in the prior year — a pronounced decline of nearly 29% despite steady operating environments enjoyed earlier in the decade [F1]. Operating cash flow also contracted by roughly 5.5%, settling at $87.2 million, signaling that core cash-generative capacity has begun to wane even as capital expenditures remained largely consistent near $7.7 million annually.
These figures illustrate that while OceanFirst managed to keep investment in property, plant, equipment, and technology effectively flat year-over-year (+1.8%), profitability pressures became evident. Dividend distributions stayed relatively stable at $48.2 million, marginally below prior payouts, while share repurchases accounted for about $24.9 million—an increase compared to zero buybacks in 2023 but still modest within its capital allocation framework.
Historical Financial Performance Summary (FY2022-FY2025)
Historical performance (annual)
| FY | Net ($mm) | CFO ($mm) | Capex ($mm) | Net YoY |
|---|---|---|---|---|
| 2025 | 71 | 87 | 8 | -29.1% |
| 2024 | 100 | 92 | 8 | -3.8% |
| 2023 | 104 | 124 | 8 | -29.0% |
| 2022 | 147 | 250 | 16 |
Source: SEC companyfacts cache [F1].
Capital returns and efficiency (annual)
| FY | Div ($mm) | Buybacks ($mm) | FCF ($mm) |
|---|---|---|---|
| 2025 | 48 | 25 | 80 |
| 2024 | 51 | 21 | 85 |
| 2023 | 51 | 0 | 117 |
| 2022 | 48 | 7 | 234 |
Source: SEC companyfacts cache [F1].
Note: Exact comparison for FY2023 CFO and capex changes are limited without full mid-year data; however, a clear long-term decline is observable from FY2022 to FY2025.
Dissecting the Drivers Behind the 2025 Profitability Contraction
The near one-third plunge in net income during 2025 stems partly from margin compression amid a competitive regional banking landscape exacerbated by integration costs related to the acquisition of Flushing Financial [N1], [N2]. Management commentary during Q4 earnings highlighted fluctuating fee income streams coupled with elevated provision expenses tied to select loan portfolio segments showing stress under evolving economic conditions [N3]. Loan portfolio diversification efforts appear underway but have not fully offset pressure points associated with narrower interest margins.
Analysts following the quarter pointed out that while loan growth remained resilient—especially in commercial lending verticals—gains were partially offset by higher cost of funds and modest erosion in non-interest income lines which often provide cushioning against rate volatility [N2], [N4]. The timing of merger integration further introduced transient costs which weighed on margin profiles before anticipated synergies can be realized.
Impact and Integration of the Flushing Financial Merger
The transaction involving Flushing Financial functions strategically as a moat enhancement device through expanding OceanFirst’s footprint beyond established New Jersey markets into adjoining regional economies [S3], . This inorganic growth approach aims to leverage scale efficiencies, cross-sell banking products across a wider deposit franchise, and streamline operating platforms.
Yet integration complexities surfaced quickly, with investor communications acknowledging potential execution risks spanning technology harmonization, regulatory approval processes, and cultural unification efforts among staff [S4]. Notably, Kahn Swick & Foti LLC initiated investigations scrutinizing the pricing adequacy of this merger deal from Flushing shareholders' perspective—a signal that deal terms did not go undisputed among stakeholders [N12].
Such legal scrutiny often reflects common frictions after sizable regional bank consolidations where appraisal value debates arise alongside expectations management around projected cost savings or revenue accretions.
Assessment of Growth Catalysts and Regional Market Dynamics
OceanFirst’s core advantage remains rooted in its deep market knowledge within mid-Atlantic neighborhoods combined with personalized banking relationships difficult for large national peers to replicate easily , [N2]. Loan book composition increasingly targets diversified commercial segments including small-to-mid-size enterprises critical for local economic activity.
Deposit gathering strategies focus on sustaining core deposits insulated somewhat from wholesale funding swings—though national banks offer stiff competition via advanced digital capabilities and broader product suites utilising fintech partnerships [N4]. Despite this competition, OceanFirst pursues digital transformation initiatives aimed at modernizing client interfaces without sacrificing trusted personal engagement—a balancing act typical among regional banking franchises striving for relevance today.
Capital Allocation: Dividends, Share Repurchases, and Returns on Equity
Capital deployment policies demonstrate prudent balancing; dividends remained largely consistent around $48 million per annum even through earnings contraction phases emphasizing commitment to stable income streams valued by retail investors [F1]. Meanwhile, share repurchase activity resumed after a hiatus with nearly $25 million spent in FY2025 suggesting some confidence in intrinsic valuation even amid sector-wide uncertainty.
Return on equity hovered near approximately 4.3%, derived from reported net income against growing equity base following merger-related balance sheet expansions [F1]. This figure signals efficiency constraints as asset growth outpaced earnings gains temporarily—a common dynamic shortly after sizable acquisitions within banking contexts where capital adequacy buffers inflate equity levels ahead of full profit ramp-up.
Future Outlook: Prospects, Risks, and Key Indicators to Monitor
Explicit guidance remains circumspect post-merger; however, company disclosures outline focus areas including seamless integration completion, credit asset quality vigilance amidst broader macro uncertainties, and margin restoration initiatives leveraging scale economics expected over subsequent quarters [S3], [S8].
Key metrics investors should observe include quarterly loan growth rates differentiated by segment, net interest margin trajectories detailing any margin compression or rebound, allowance for credit losses reflecting asset quality shifts, plus cost-income ratio trends measuring operational leverage realized from merged operations.
Risks persist notably around potential regulatory shifts affecting capital requirements alongside dynamic competitive pressures both from national banking entities deploying robust digital platforms and fintech firms eroding traditional fee pools — all exerting downward momentum on profit margins inherent for regional banks like OceanFirst ([S4], valye_report_excerpt).
In summary, OceanFirst Financial Corp stands at an inflection point blending its intrinsic localized banking strengths with ambitious scaling strategies via mergers that reshape its financial contours markedly in 2025 but bring inherent execution complexities ahead.
Disclaimer: This is research-only, informational analysis and not investment advice. It may include AI-generated interpretation and general industry context. Always verify important details using primary sources.
Comments