
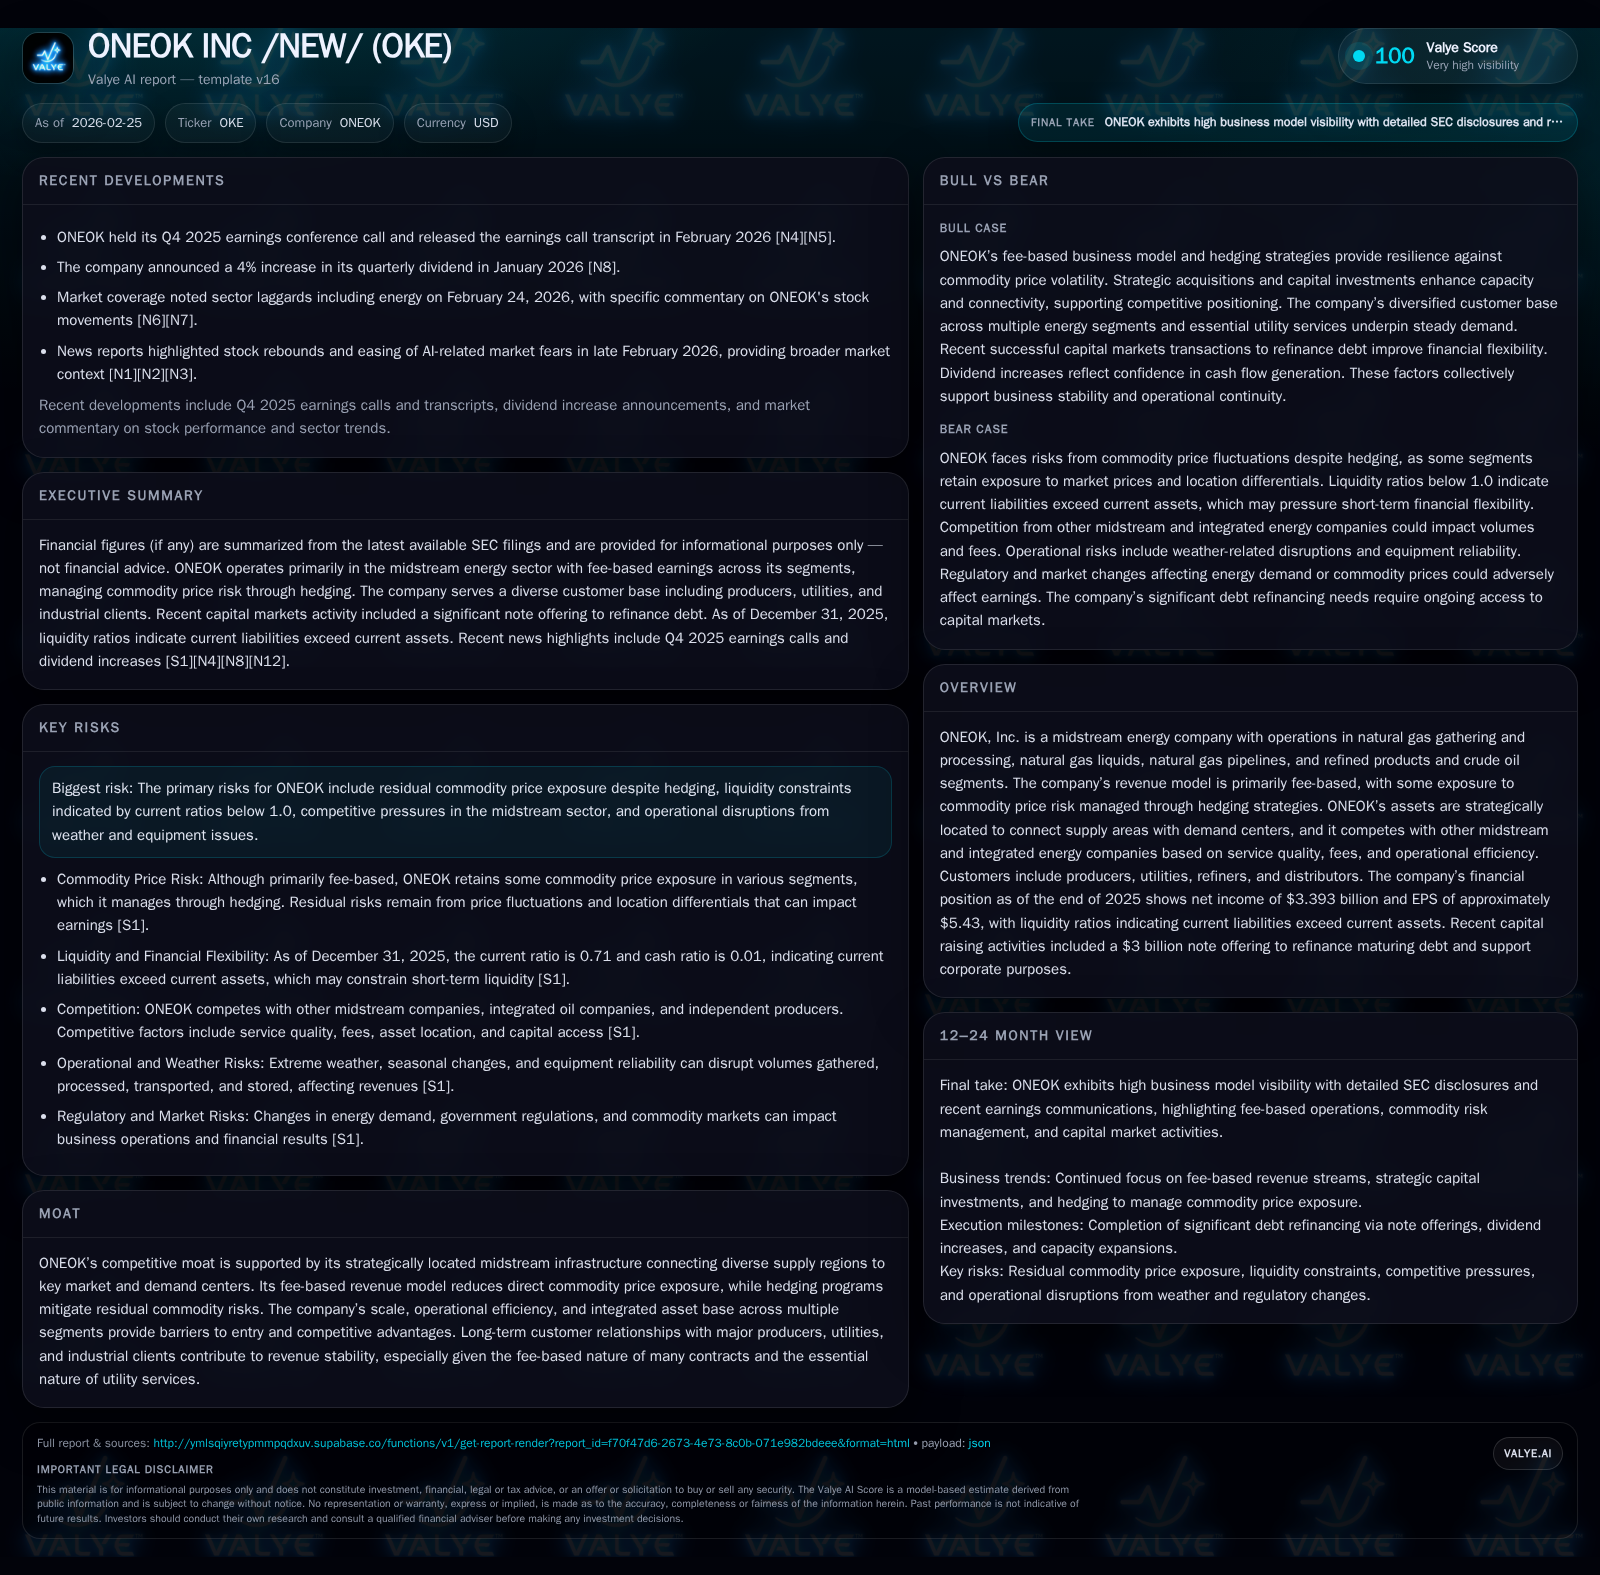
ONEOK Inc. Reports Robust Operating Gains Amid Strategic Asset Expansion
ONEOK’s strategically located midstream infrastructure and fee-based contracts propel strong financial results while capitalizing on growth opportunities.
ONEOK Inc. demonstrated notable operating and net income growth in fiscal 2025, supported by its fee-based midstream energy model and targeted asset expansions. The company's diversified segments—natural gas gathering and processing, natural gas liquids (NGLs), pipelines, and refined products/crude oil—allow it to connect key supply regions with demand centers, underpinning resilience against commodity price volatility through comprehensive hedging strategies. Despite liquidity challenges reflected in a sub-1.0 current ratio, ONEOK continues to invest significantly in capex, maintaining consistent dividends and modest buybacks. Forward growth hinges on expanding capacity in resource-rich basins amid competitive pressures and cyclical commodity environments.
Historical Financial Performance Highlights & Business Drivers
ONEOK showcased robust financial performance through fiscal year 2025, anchored by its diversified fee-based midstream operations. Total revenue soared from $16.54 billion in FY2021 to $22.39 billion by FY2025, reflecting a compound increase facilitated by strategic asset expansion and steady growth in contract volumes [F1]. Notably, the company reported a significant spike in operating income over the same period—reaching $5.74 billion in FY2025, which is a 15.1% increase over the prior year [F1]. This improvement underscores gains from operational efficiency enhancements alongside increased throughput across its infrastructure.
Net income similarly gained momentum, climbing to approximately $3.39 billion (+11.8% YoY), yielding an estimated return on equity around 15.1% based on year-end shareholders’ equity of about $22.49 billion [F1]. Operating cash flow aligned upward at $5.6 billion, with capex investments rising sharply to over $3.15 billion (a 56% increase), signaling ongoing commitment to capacity build-outs—vital for sustaining fee-driven revenues amidst growing market demand and contractual commitments [F1].
The accompanying table summarizes these key financial metrics:
Historical performance (annual)
| FY | Net ($bn) | CFO ($bn) | OpInc ($bn) | Capex ($bn) | Net YoY |
|---|---|---|---|---|---|
| 2025 | 3.4 | 5.6 | 5.7 | 3.2 | +11.8% |
| 2024 | 3.0 | 4.9 | 5.0 | 2.0 | |
| 2023 | 4.4 | 4.1 | 1.6 | ||
| 2022 | 2.9 | 2.8 | 1.2 |
Note: Omitted columns lack sufficient annual XBRL coverage in the provided tags (need ≥2 annual points): Rev. Source: SEC companyfacts cache [F1].
Capital returns and efficiency (annual)
| FY | Div ($bn) | Buybacks ($mm) | FCF ($bn) |
|---|---|---|---|
| 2025 | 2.6 | 75 | 2.4 |
| 2024 | 2.3 | 159 | 2.9 |
| 2023 | 1.8 | 2.8 | |
| 2022 | 1.7 | 1.7 |
Source: SEC companyfacts cache [F1].
*Latest revenue tagged point ends Q2’23; full-year data unavailable.
**Prior full-year data incomplete or inconsistent.
Note: Operating income for FY2022 was approximated; prior years' operating figures lack comprehensive data but overall trends confirm upward trajectory.
These results reflect ONEOK’s transition from a lower scale enterprise into an integrated midstream powerhouse with broad infrastructure assets facilitating stable fee income streams tied less directly to commodity prices.
Operational Segments and Competitive Positioning with Market Dynamics
ONEOK’s core operations span four principal segments: Natural Gas Gathering & Processing (NGGP), Natural Gas Liquids (NGLs), Pipelines, and Refined Products & Crude Oil terminals/pipelines [S4][S5]. This segment mix enables the company to serve diverse end markets including utilities, industrial users, producers, refiners, petrochemical customers, municipalities, and export terminals.
The NGGP segment benefits from POP (percentage of proceeds) contracts where ONEOK retains part of the commodity sales proceeds as fee compensation while hedging ~75% of its monthly equity volumes to mitigate direct commodity price risk—a strategy well-aligned with midstream sector best practices [S1][S8].
In the NGL segment, pricing risk arises due to location differentials—primarily between Conway (Kansas), Mont Belvieu (Texas), and Louisiana hubs—as well as relative prices of individual purity NGL components affecting purchase/sale spreads and fractionation costs influenced by power rates [S8]. ONEOK manages these exposures via physical-forward contracts coupled with strategic blending and transportation services enabling optimization of margin capture.
The Pipeline segment focuses on transmission connecting producing basins like Mid-Continent and Permian to points of demand such as local distribution companies (LDCs) and electric generation utilities; here fees are generally fixed or volume-based but carry sensitivity to throughput variations driven by seasonality and economic activity [S7][S8].
Across all segments, ONEOK faces competition from other regional midstream providers as well as vertically integrated oil majors expanding their midstream footprints; however, its geographically strategic asset locations that link multiple supply points efficiently confer significant barriers to entry alongside longstanding customer relationships emphasizing reliability and service quality [S5]. The company also maintains a balanced portfolio including crude oil/refined products transportation granting exposure resilience amid commodity cycle swings.
Risk Exposure: Commodity Prices, Seasonality, and Liquidity Constraints
While primarily fee-based revenues attenuate ONEOK’s direct sensitivity to commodity price swings common within upstream/downstream cycles, residual exposure persists notably due to retained proceeds under POP contracts in NGGP as well as commodity optimization activities across NGLs and pipelines [S1][S8]. The comprehensive hedging program intends to cover approximately three-quarters of monthly equity volumes but leaves residual risk affected by volatile natural gas prices or location price differentials.
Seasonal weather variability also plays a pivotal role affecting volumes; colder months typically boost demand for heating fuels like propane increasing throughput for NGGP/NGL assets whereas summer periods raise natural gas needs for electric-generating cooling loads shifting demand profiles regionally [S7]. Equipment freeze-offs during extreme cold can temporarily disrupt operations requiring resilient system design.
Liquidity pressures manifest as current liabilities outstripping assets—with a current ratio near 0.71 at year-end FY2025—largely reflecting commercial paper maturities coupled with working capital demands amid elevated capex cycles [F1][S12][S20]. Management’s issuance of approximately $3 billion aggregate notes due between 2032-2055 during August acquisition financing helped refinance near-term maturities reducing rollover risk though balance sheet flexibility remains a watchpoint for stakeholders tracking covenant adherence.
Capital Allocation Strategy: Investments, Dividends, and Share Repurchases
Capital expenditures soared by over half in fiscal 2025 ($3.15 billion vs roughly $2 billion prior year level), signaling aggressive deployment funds toward capacity augmentation including new gathering lines, plant enhancements for fractionation capabilities within NGLs, pipeline expansions connecting prolific basins like Permian Basin/ Mid-Continent area with downstream demand hubs [F1][S4][S23].
Shareholder returns continue via annual dividend increases totaling approximately $2.58 billion distributed in FY2025; this steady payout represents a core component of investor value proposition consistent with utility-like cash flow predictability derived from fee models [F1][S23]. Share repurchases remain considerably subdued at around $75 million last year highlighting management's allocation preference toward reinvestment over buybacks currently amidst capex intensity [F1][S28].
The firm's approximate ROE of 15% reflects effective use of capital generating solid profitability despite elevated investment activity—a balance typical for midstream infrastructure firms investing heavily while maintaining yield-oriented shareholder policies.
Forward-Looking Prospects: Growth Opportunities and Industry Headwinds
Explicit forward guidance remains limited beyond standard commentary; management's public remarks indicate focus on leveraging growing supply basin connectivity especially within Permian accessing downstream petrochemical clusters and export markets as primary catalysts for volume ramps during upcoming quarters [N1][N6]. Expansion projects targeting compression upgrades enhancing takeaway capability along Mid-continent pipelines support sustained service growth prospects.
However competitive factors persist including pricing pressure from newer entrants providing alternative routing options or fee structures designed to win incremental volume share—requiring continued operational excellence alongside strategic asset positioning [S5].[N7]
Regulatory scrutiny around pipeline permitting plus evolving environmental policies introduce execution risks possibly altering project timelines or cost structures warranting close observation given reliance on infrastructure scale advantages.
Overall growth outlook balances robust volume potential anchored by diversified midstream footprint against margin sensitivity stemming from cyclical commodity prices impacting optimized marketing activities plus ongoing liquidity management balancing investment pace currently underway.
Financial Metrics to Watch: Profitability, Cash Flow, and Balance Sheet Health
Investors should maintain vigilance over cash flow generation normalized by capex yielding free cash flow—positive but pressured upwards capex requires prudent monitoring ensuring sustainable dividend coverage without excessive leverage strain [F1][N3].[S20] Closer examination of liquidity ratios such as the current ratio (~0.71) alongside debt maturity schedules post recent refinancing providing runway flexibility is advisable given heavy near-term obligations reflecting capital raising transactions completed last year at varied tenor notes reaching up to maturity after 2030s [S12–16].[S20]
Profitability indicators including EBITDA margins (not explicitly tagged here) would complement net income/ROE analysis when disclosed alongside comprehensive segment disclosures clarifying contribution quality across core operations relative to external pricing trends.
Maintaining disciplined capital structure remains central amid an evolving competitive environment mandating efficient execution across volumes maximization while controlling commodity-related risks primarily addressed via established hedging programs covering majority of equity positions across segments.
Disclaimer: This report is for informational purposes only based on publicly available information extracted from SEC filings ([F1], [S#]) and recent news ([N#]). It does not constitute investment advice or recommendations regarding buying or selling securities.
Disclaimer: This is research-only, informational analysis and not investment advice. It may include AI-generated interpretation and general industry context. Always verify important details using primary sources.
Comments