
Offerpad’s Revenue Retreat and Operational Efficiency: Balancing Innovation with Capital Challenges
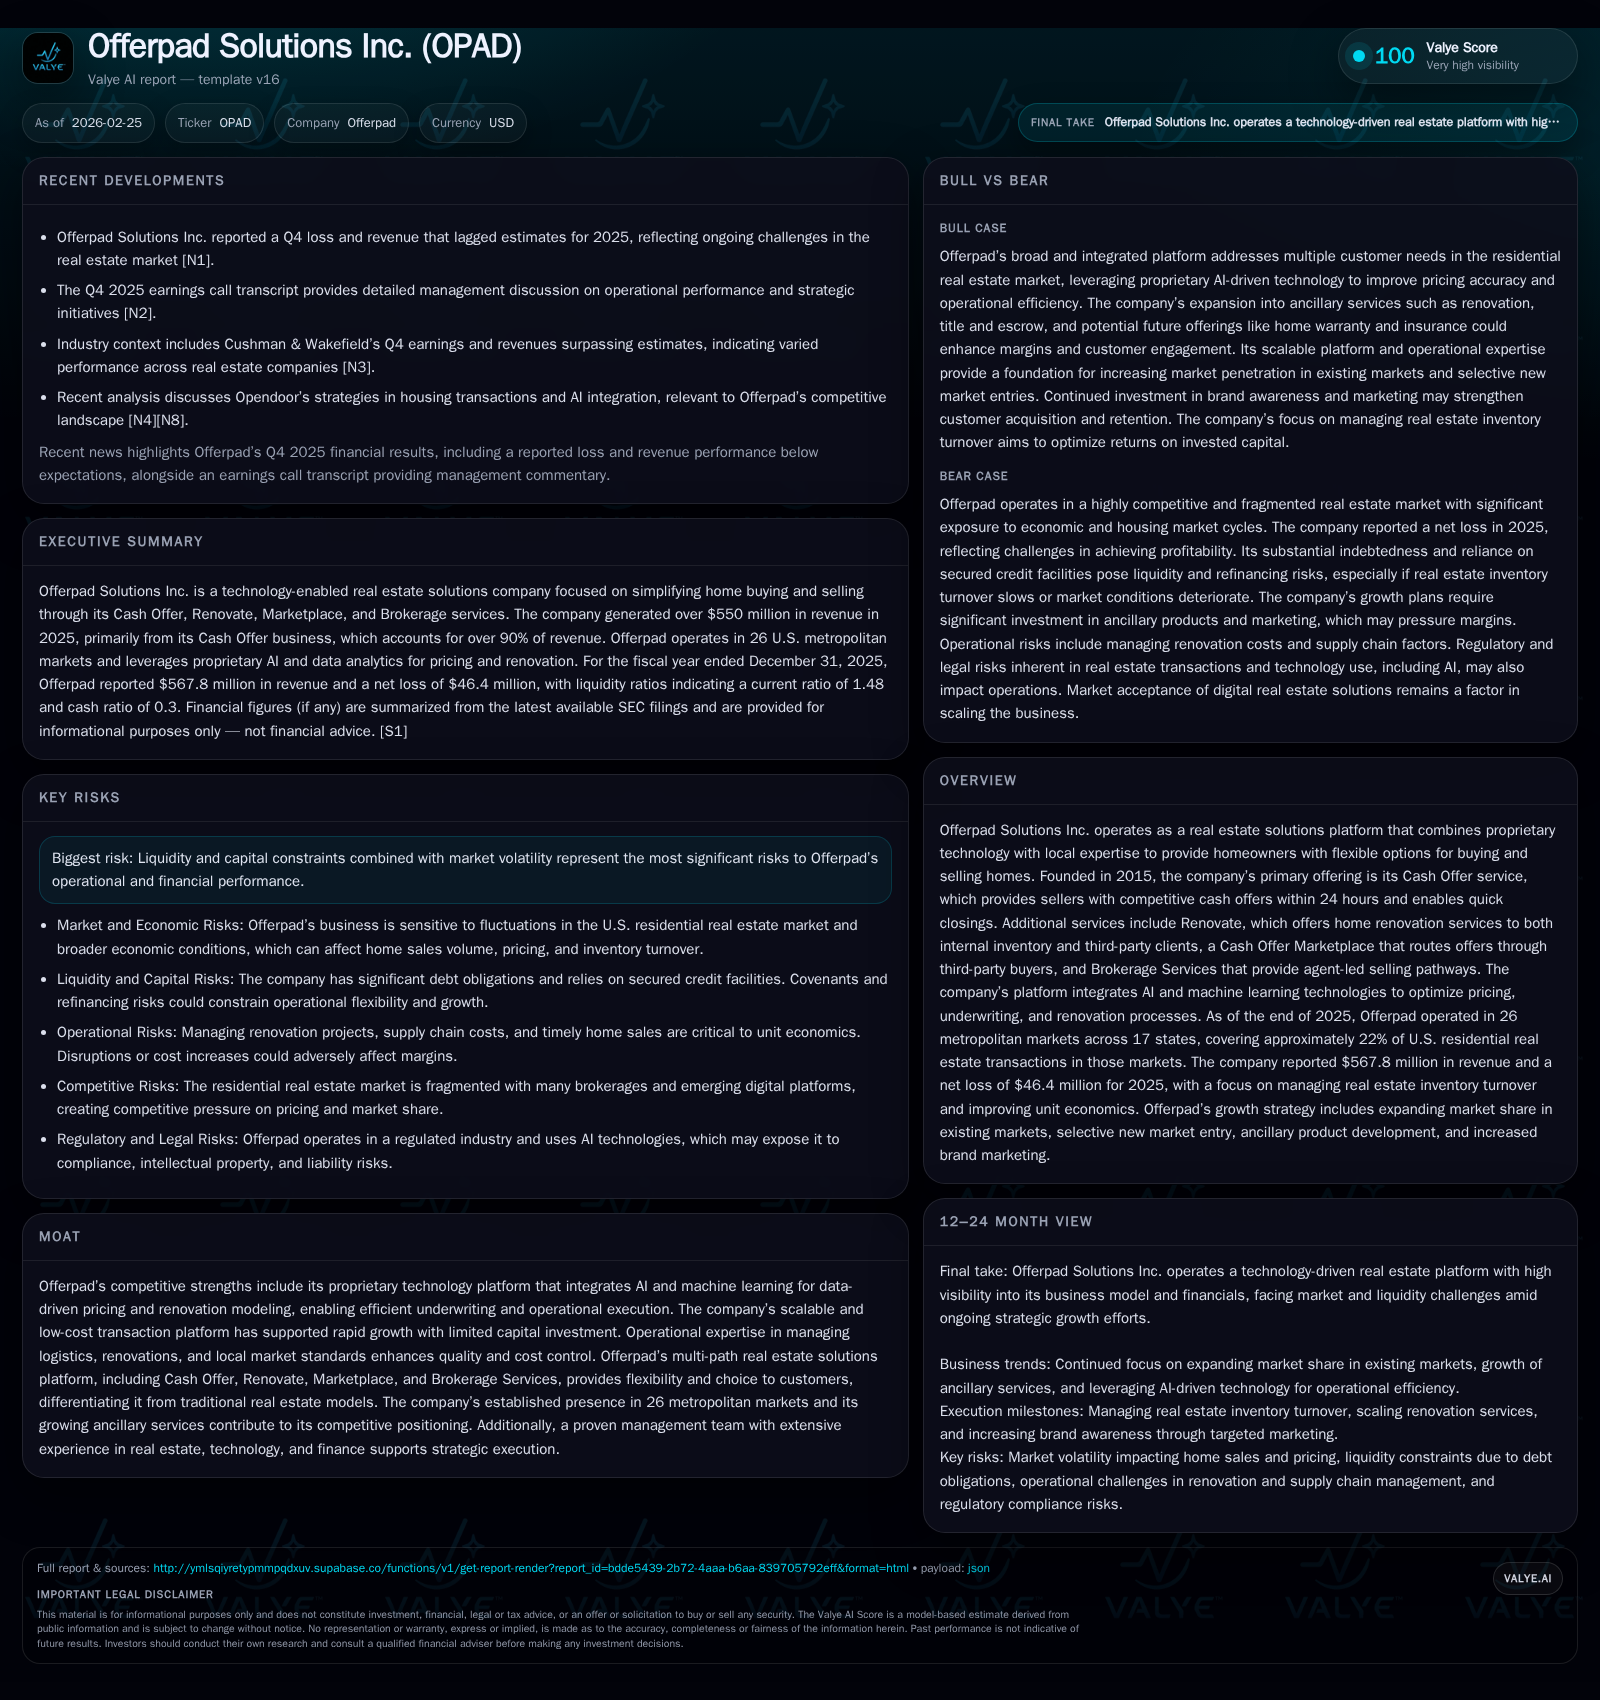
Offerpad Solutions Inc. confronts a stark revenue contraction yet advances operational efficiency through AI-driven innovations while grappling with liquidity constraints.
Offerpad Solutions has experienced a significant pullback in revenue, declining by over 38% year-over-year in 2025, reflecting ongoing challenges in the U.S. residential real estate market. Despite this, the company improved its operating loss by nearly 28%, leveraging its AI-powered platform and diversified service offerings beyond cash home purchases. However, capital structure limitations and liquidity pressures underline risks to sustaining growth. Future expansion depends on scaling ancillary services and careful financing management amid a still volatile housing environment.
From Rapid Expansion to Revenue Retraction: Reviewing Offerpad's Recent Performance
Offerpad Solutions’ trajectory shows a marked contraction in fiscal 2025 results. Revenues fell sharply to approximately $567.8 million, down 38.2% from $918.8 million in FY2024 [F1]. This decline reflects macroeconomic pressures on the U.S. single-family resale market—the core segment served—characterized by lower transaction volumes amid affordability challenges and elevated mortgage rates [S1][N1][N2]. The company sold nearly 1,600 homes during the year via its Cash Offer platform, indicating constrained demand [S13].
Operational efficiencies contributed to an improvement in operating losses from -$46.0 million to -$33.4 million year-over-year—a roughly 27.5% reduction—highlighting better cost management and margin improvements particularly outside its primary Cash Offer business line [F1]. Net losses also improved by over 25%, narrowing from -$62.2 million to -$46.4 million [F1].
Historical performance (annual)
| FY | Rev ($mm) | Net ($mm) | CFO ($mm) | OpInc ($mm) | Rev YoY | Net YoY |
|---|---|---|---|---|---|---|
| 2025 | 568 | -46 | 67 | -33 | -38.2% | +25.4% |
| 2024 | 919 | -62 | 21 | -46 | +47.0% | |
| 2023 | -117 | 262 | -104 | +21.1% | ||
| 2022 | -149 | 305 | -127 |
Note: Omitted columns lack sufficient annual XBRL coverage in the provided tags (need ≥2 annual points): Capex, Div, Buybacks. Source: SEC companyfacts cache [F1].
Capital returns and efficiency (annual)
| FY | FCF ($mm) | ROE% |
|---|---|---|
| 2025 | 66 | -121.4 |
| 2024 | 15 | -130.4 |
| 2023 | 262 | -115.2 |
| 2022 | 304 | -121.9 |
Source: SEC companyfacts cache [F1].
Note: Historical revenue prior to FY2024 not available; capex changes uneven due to limited data.
Technology-Enabled Differentiation: The Role of AI in Offerpad’s Multi-Path Platform
Offerpad leverages a proprietary technology stack integrating artificial intelligence and machine learning to enhance valuation accuracy, underwriting precision, and renovation efficiency across its platform [S14]. Its "Citrus Value" pricing engine combined with the "Offercomp" automated valuation system processes hundreds of data points per property—including public records and computer vision image analysis—to deliver competitive cash offers aligned closely with actual sale prices.
The "Helix Go" technology further automates renovation logistics and labor management enabling scalable operations across diverse markets without proportional increases in manual oversight [S14]. This synergy between data-driven insights and operational automation constitutes a competitive moat against fragmented traditional real estate models.
Diverse Solutions Portfolio Beyond Cash Offers
While the Cash Offer solution remains foundational—accounting for over 90% of revenues—the company has grown ancillary offerings such as Renovate services and the Cash Offer Marketplace which now contribute roughly one-quarter of consolidated gross profits with superior margins [F1][S7][S13]. In FY2025 alone, Offerpad completed close to 1,500 renovation projects alongside home sales [S13], signaling growing diversification.
These ancillary services enhance unit economics by generating fee-based revenue streams less reliant on asset-heavy home flipping margins.
Liquidity Tightness and Capital Structure Constraints
As of December 31, 2025, Offerpad held approximately $26.5 million in cash against total debt exceeding $93 million under secured credit facilities—a leverage profile that imposes refinancing risks especially amid tightening credit markets [F1][S5][S6][S8][S18]. Debt agreements contain covenants requiring maintenance of tangible net worth and liquidity thresholds; temporary waivers granted during parts of FY2025 underscore potential fragility if economic conditions deteriorate further [S6].
Repayment or refinancing obligations arise typically within three-to-six months following revolving period expirations for facilities supporting home acquisition financing [S6][S18], creating near-term liquidity event risks.
Cautious Growth Outlook: Market Coverage & Product Expansion Plans
Offerpad operates in 26 metropolitan U.S. markets covering about 22% of national residential transactions by volume—focused on high-density urban centers with favorable demographics [S12]. The company plans to deepen penetration within these existing markets via increased local advertising and brand awareness programs while cautiously pursuing new market entries given current economic uncertainties [S7][S9][S12].
Ancillary product expansion includes energy efficiency solutions, smart home technology, insurance products, and home warranties aiming to improve per-transaction profitability and extend customer engagement lifecycles [S7][S9].
Cash Flow Improvements & Capital Allocation Considerations
Despite ongoing net losses impacting equity ($38 million at FY-end ’25 down from $47.7 million), operating cash flow surged more than threefold from $20.8 million in FY2024 to $66.8 million in FY2025 due primarily to working capital efficiencies [F1]. Capital expenditures declined substantially to approximately $1 million reflecting restrained reinvestment amid operational focus on cash preservation.
Free cash flow remained robust at about $65.7 million (operating cash flow minus capex), signaling disciplined capital management despite profitability challenges.
Return on equity remains deeply negative at roughly -121%, reflecting sustained net losses since inception without dividend payments or share repurchases reported recently [F1].
Key Milestones Ahead: Monitoring Growth & Financial Stability Metrics
Critical near-term milestones include:
- Scaling Renovate segment margins through operational leverage;
- Expanding third-party participation within the Cash Offer Marketplace;
- Maintaining compliance with restrictive debt covenants or securing waivers;
- Increasing customer conversion rates essential for volume recovery amid macroeconomic headwinds.
Tracking these indicators will illuminate whether technological investments combined with operational improvements can translate into sustainable profitability while maintaining liquidity buffers under constrained financing conditions [N2][N1][S6].
This report is based exclusively on publicly filed disclosures by Offerpad Solutions Inc., third-party news sources cited herein, and Valye News proprietary analysis grounded in industry knowledge as of February 25, 2026. No investment advice or recommendations are offered or implied herein.
Disclaimer: This is research-only, informational analysis and not investment advice. It may include AI-generated interpretation and general industry context. Always verify important details using primary sources.
Comments