
Pool Corp's Revenue Slip Challenges Its Market Dominance
Despite leading the global wholesale swimming pool supplies market, Pool Corp faces emerging headwinds as recent financials reveal revenue and earnings contractions.
Pool Corp remains the world’s largest wholesale distributor of swimming pool supplies, supported by an extensive network and broad product portfolio. Fiscal year 2025 saw a slight revenue decline alongside sharper drops in operating income and cash flow, reflecting operational challenges amid economic cyclicality and competitive pressures. Strategic expansions through acquisitions, digital innovation, and proprietary brands underpin its competitive position, while capital allocation balances shareholder returns with measured investments amid seasonal and supply chain dynamics.
Historical Performance and Market Position
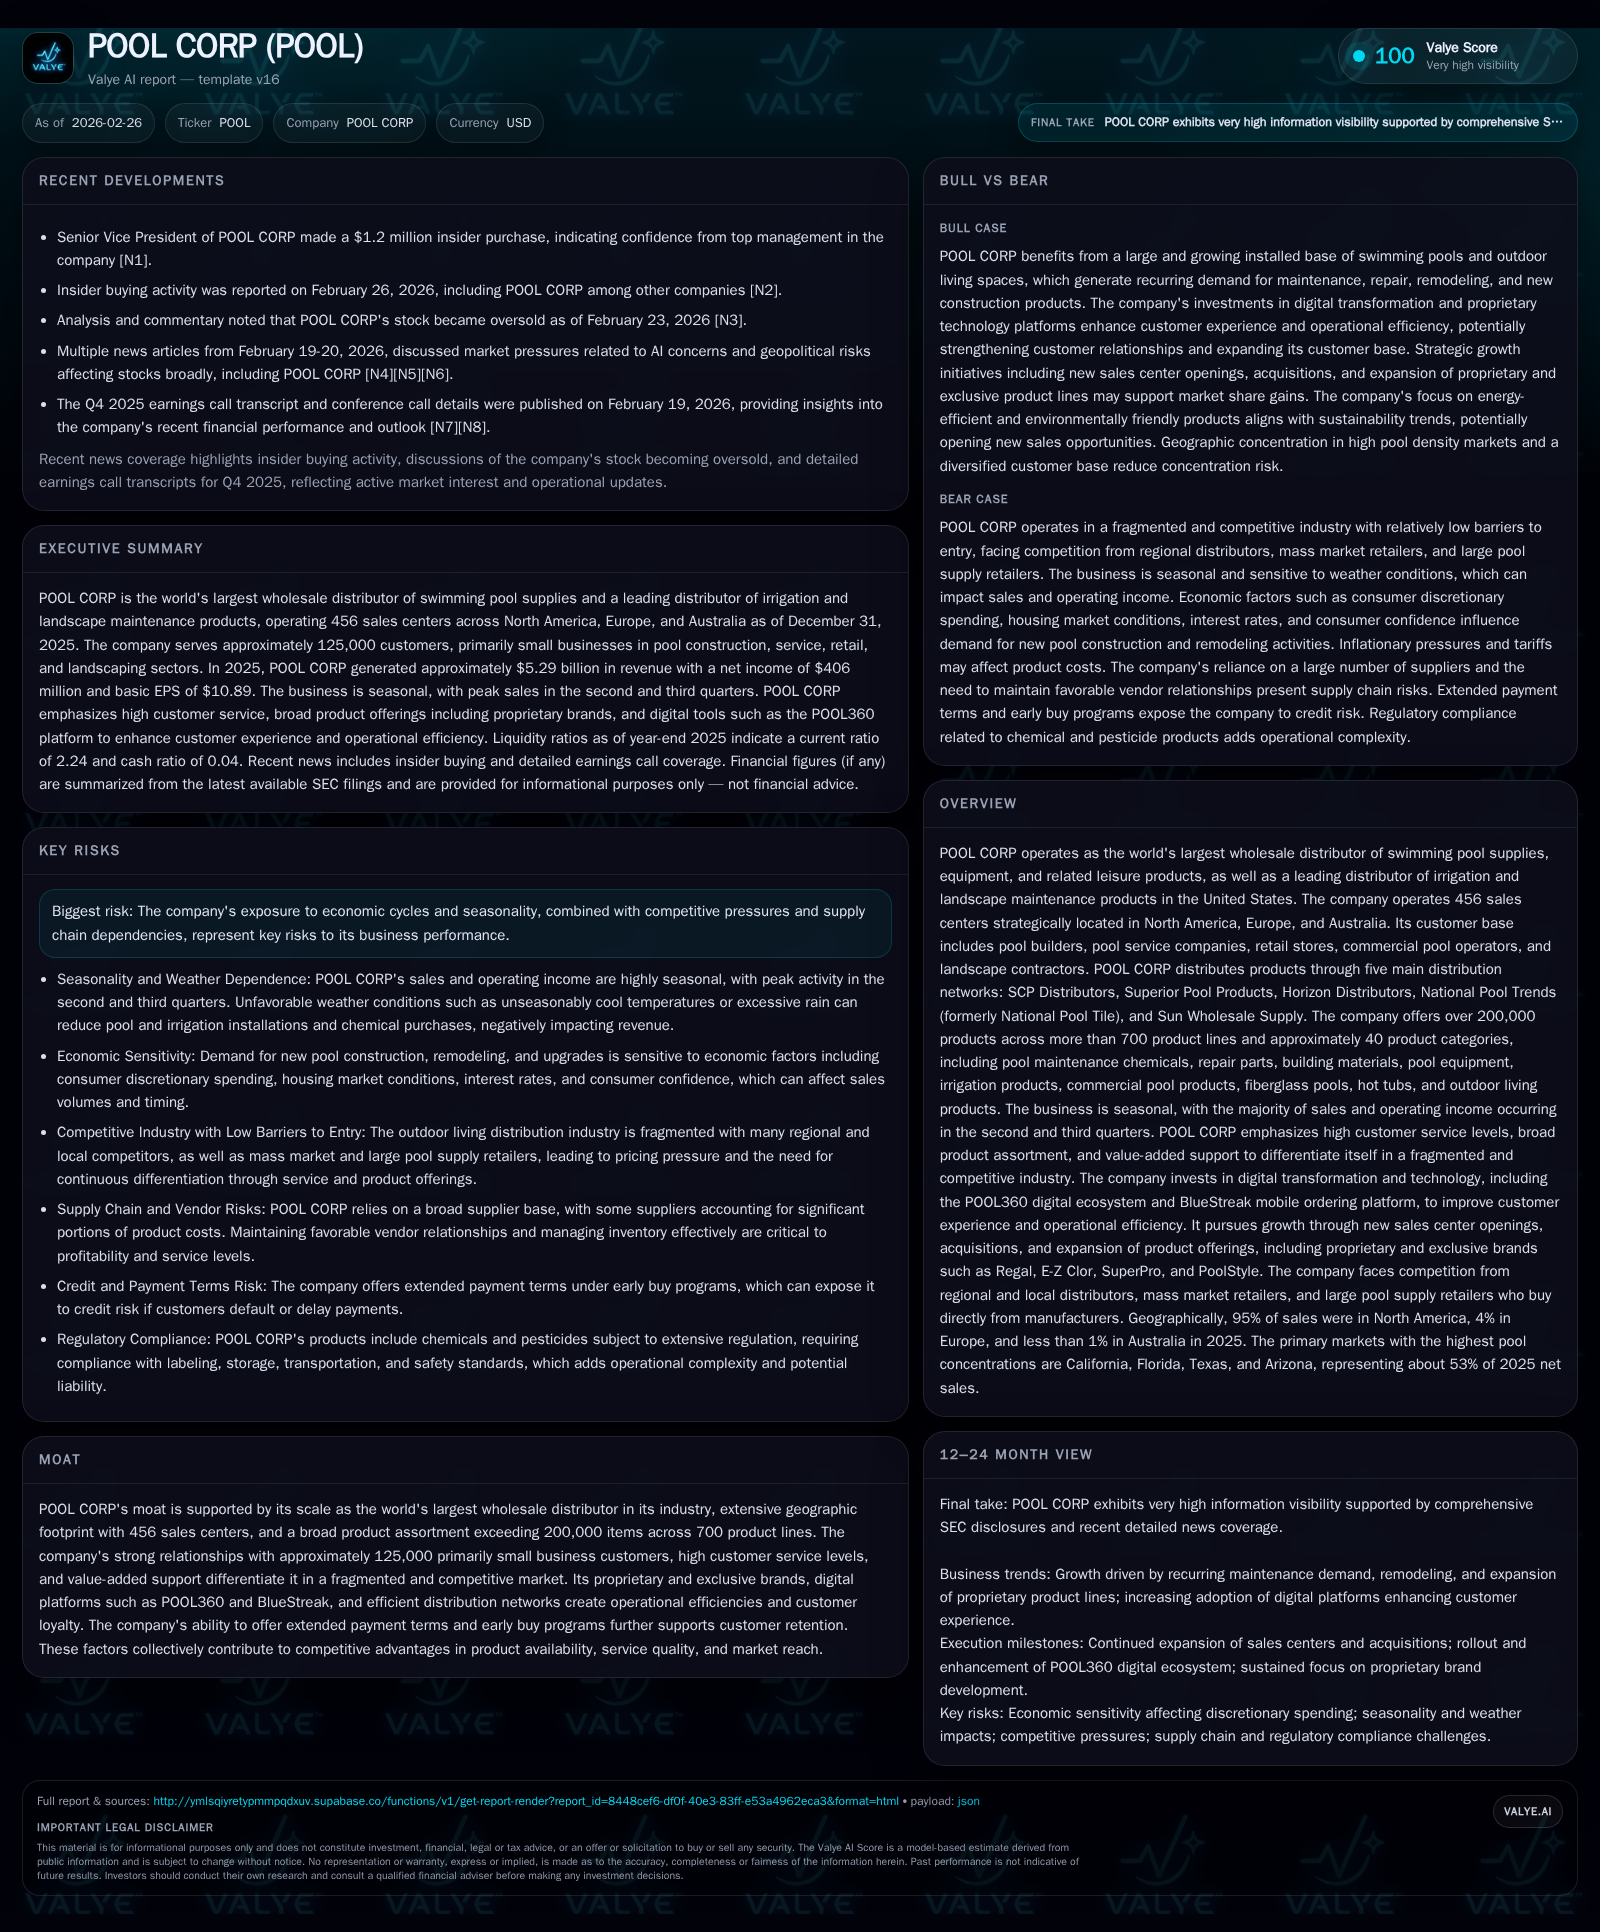
Pool Corp is the world’s largest wholesale distributor specializing in swimming pool supplies, equipment, and related leisure products. As of December 31, 2025, it operated 456 sales centers across North America, Europe, and Australia [S1], serving approximately 125,000 customers primarily composed of small entrepreneurial businesses including pool builders, service companies, retailers, commercial operators, and landscape contractors [S4].
Its product catalog exceeds 200,000 items across roughly 700 product lines spanning some 40 categories — ranging from pool chemicals and repair parts to hardscapes and irrigation systems — providing a comprehensive offering that distinguishes it within a fragmented industry [S4][S12].
Growth has historically been driven by organic expansion via new sales centers aligned with demographic shifts toward warmer climates along with strategic acquisitions. The company leverages pre-season early buy programs allowing inventory purchases during off-peak months under favorable terms to optimize stock levels [S4][S6].
Historical performance (annual)
| FY | Rev ($bn) | Net ($mm) | CFO ($mm) | OpInc ($mm) | Rev YoY | Net YoY |
|---|---|---|---|---|---|---|
| 2025 | 5.3 | 406 | 366 | 580 | -0.4% | -6.4% |
| 2024 | 5.3 | 434 | 659 | 617 | +429.5% | +744.4% |
| 2023 | 1.0 | 51 | 888 | 747 | -8.5% | -28.4% |
| 2022 | 1.1 | 72 | 485 | 1026 |
Source: SEC companyfacts cache [F1].
Capital returns and efficiency (annual)
| FY | Div ($mm) | Buybacks ($mm) | FCF ($mm) |
|---|---|---|---|
| 2025 | 185 | 346 | 310 |
| 2024 | 180 | 306 | 600 |
| 2023 | 167 | 306 | 828 |
| 2022 | 151 | 471 | 441 |
Source: SEC companyfacts cache [F1].
Note: FY2023-25 figures reflect consolidated reporting adjustments; revenue shown on consolidated basis starting FY2023.
FY2025 Financial Overview: Signs of Operational Stress
In FY2025, Pool Corp's revenue slightly declined to $5.29 billion from $5.31 billion the prior year (-0.4%) [F1]. Operating income decreased by about six percent to $580 million while net income fell approximately 6.4% to $406 million [F1]. More notably, operating cash flow dropped nearly forty-five percent year-over-year to $366 million suggesting potential working capital constraints or shifts in accounts receivable/payable timing [F1].
Q4 earnings commentary highlighted margin compression influenced by seasonal effects and elevated freight costs amid ongoing supply chain challenges [N1][N3][N4]. Investor reaction was negative with a twelve percent stock drop following the earnings announcement reflecting concerns over momentum loss.
Seasonality plays a significant role with roughly sixty-one percent of annual net sales concentrated in the summer quarters Q2-Q3; extended payment terms under early buy programs shift cash inflows into later periods affecting liquidity dynamics especially when consumer discretionary spending softens within residential construction segments [S5][S22].
Diverse Product Lines and Market Reach
Pool Corp operates across multiple verticals within outdoor living including residential swimming pools—the largest segment—commercial pools serving hotels and universities with bid-to-spec design input capabilities; irrigation systems tied closely to housing construction; landscape maintenance products like organic fertilizers; plus complementary outdoor living goods such as grills which broaden customer baskets without relying solely on core chemical or equipment sales [S9][S13][S15].
Geographically concentrated markets—California, Florida, Texas, and Arizona—account for approximately fifty-three percent of net sales where pool density is highest but competition is also intense from regional wholesalers and large retailers leveraging e-commerce channels [S5][S10]. The company seeks growth through proprietary brand extensions (e.g., Regal chemicals; SuperPro equipment lines) emphasizing sustainability trends such as energy-efficient pumps or saltwater chlorinators meeting rising homeowner demand for greener technologies [S9][S15].
Proprietary Brands Coupled With Digital Innovation
Pool Corp's moat benefits from exclusive proprietary brands alongside significant investments in digital platforms enhancing operational efficiency. Notable brands include Regal Chemicals and E-Z Clor Pool Care supported by POOL360 B2B suite integrating real-time inventory with e-commerce capabilities. The BlueStreak mobile ordering platform enables field sales associates to process orders rapidly onsite eliminating customer wait times—a key advantage during peak seasons [S4][S7][S17].
These technologies reduce order cycle times while vendor-managed inventory programs optimize stocking levels improving margins especially important given chemical perishability. Credit risk management benefits from integration with extended payment terms typical under pre-season contracts [S17].
Economic Sensitivities and Competitive Landscape
The business remains vulnerable to macroeconomic cycles affecting discretionary spending particularly new pool construction which declined approximately three to five percent unit-wise from an estimated ~62K units in FY2024 to just under ~60K units in FY2025 amid higher mortgage rates dampening housing turnover [S16]. Renovation demand fluctuates with home equity trends.
Competition is intense across major markets with low barriers to entry inviting numerous regional distributors competing aggressively alongside mass-market retailers who leverage scale purchasing disrupting traditional wholesale economics. Internet retailing increases price transparency challenging pricing power.
Supplier dependencies pose risks; major suppliers like Pentair plc accounted for twenty percent of procurement costs while others like Zodiac Pools contributed significant portions amplifying exposure to cost inflation or availability disruptions amid tariffs or commodity volatility [S6][N3].
Capital Allocation: Balanced Returns Amid Investment
Pool Corp maintained disciplined capital deployment in FY2025 allocating approximately $185 million toward dividends consistent with prior years supporting steady shareholder yields while repurchasing about $346 million of shares underscoring commitment to returning excess capital responsibly [F1][S25][S29].
Capital expenditures were moderate at near $56 million focused on capacity expansion including new sales centers timed before peak seasons plus technology infrastructure upgrades enhancing B2B platform capabilities rather than expanding physical footprint aggressively preserving free cash flow liquidity amid credit market conditions.
With equity around $1.19 billion at year-end translating into an approximate return on equity exceeding thirty-four percent despite profit pressure signals financial strength underpinning future flexibility for M&A or targeted bolt-on acquisitions aligned with stated growth objectives for geographic expansion or product line extension [F1].
Outlook: Key Milestones Ahead
Forward-looking commentary emphasizes ongoing expansion plans including new sales center openings especially outside core Sunbelt states aiming at geographic diversification; growth of proprietary brands focusing on energy-efficient outdoor living products; progressive rollout of digital tools such as enhancements within POOL360 WaterTest software critical for customer retention/acquisition metrics; and commercial pools vertical flagged as a key growth contributor backed by dedicated warehouses established mid-2025 [N1][N6][S4].
Monitoring liquidity trends during early buy pre-season periods will provide insights into customer confidence distinct from broader economic uncertainty ahead of peak installation quarters.
Risks Persist: Seasonality, Supply Chain Complexity & Competition
Seasonality remains pronounced with about sixty-one percent of revenues generated during summer months causing quarterly earnings volatility complicating short-term forecasting. Weather anomalies can abruptly impact buying patterns—from delayed spring purchases due to cool weather to accelerated demand from heat spikes—but are managed via inventory positioning through regional centralized shipping locations enabling nimble replenishment strategies [S19][N3].
Credit risks arise due to extended payment terms offered during early buy programs requiring prudent allowance provisioning given many customers are small businesses; however broad diversification limits single-customer exposure below ten percent threshold mitigating concentration risk [S22].
Competitive intensity increases domestically among numerous local/regional players plus growing e-commerce direct manufacturer-sales models necessitating continuous service innovation including expedited shipping likely pressuring margins going forward.
This analysis integrates Pool Corp’s latest publicly available filings combined with sector-specific context without extending investment recommendations beyond company disclosures.
Disclaimer: This is research-only, informational analysis and not investment advice. It may include AI-generated interpretation and general industry context. Always verify important details using primary sources.
Comments