
How Pershing Square’s Corporate Conversion Reshapes Its Value Investing Franchise
Pershing Square Inc.’s Q1 2026 results reflect the operational and financial recalibration following its corporate conversion and Combined IPO, spotlighting a scalable permanent capital model that underpins its distinctive value investing approach.
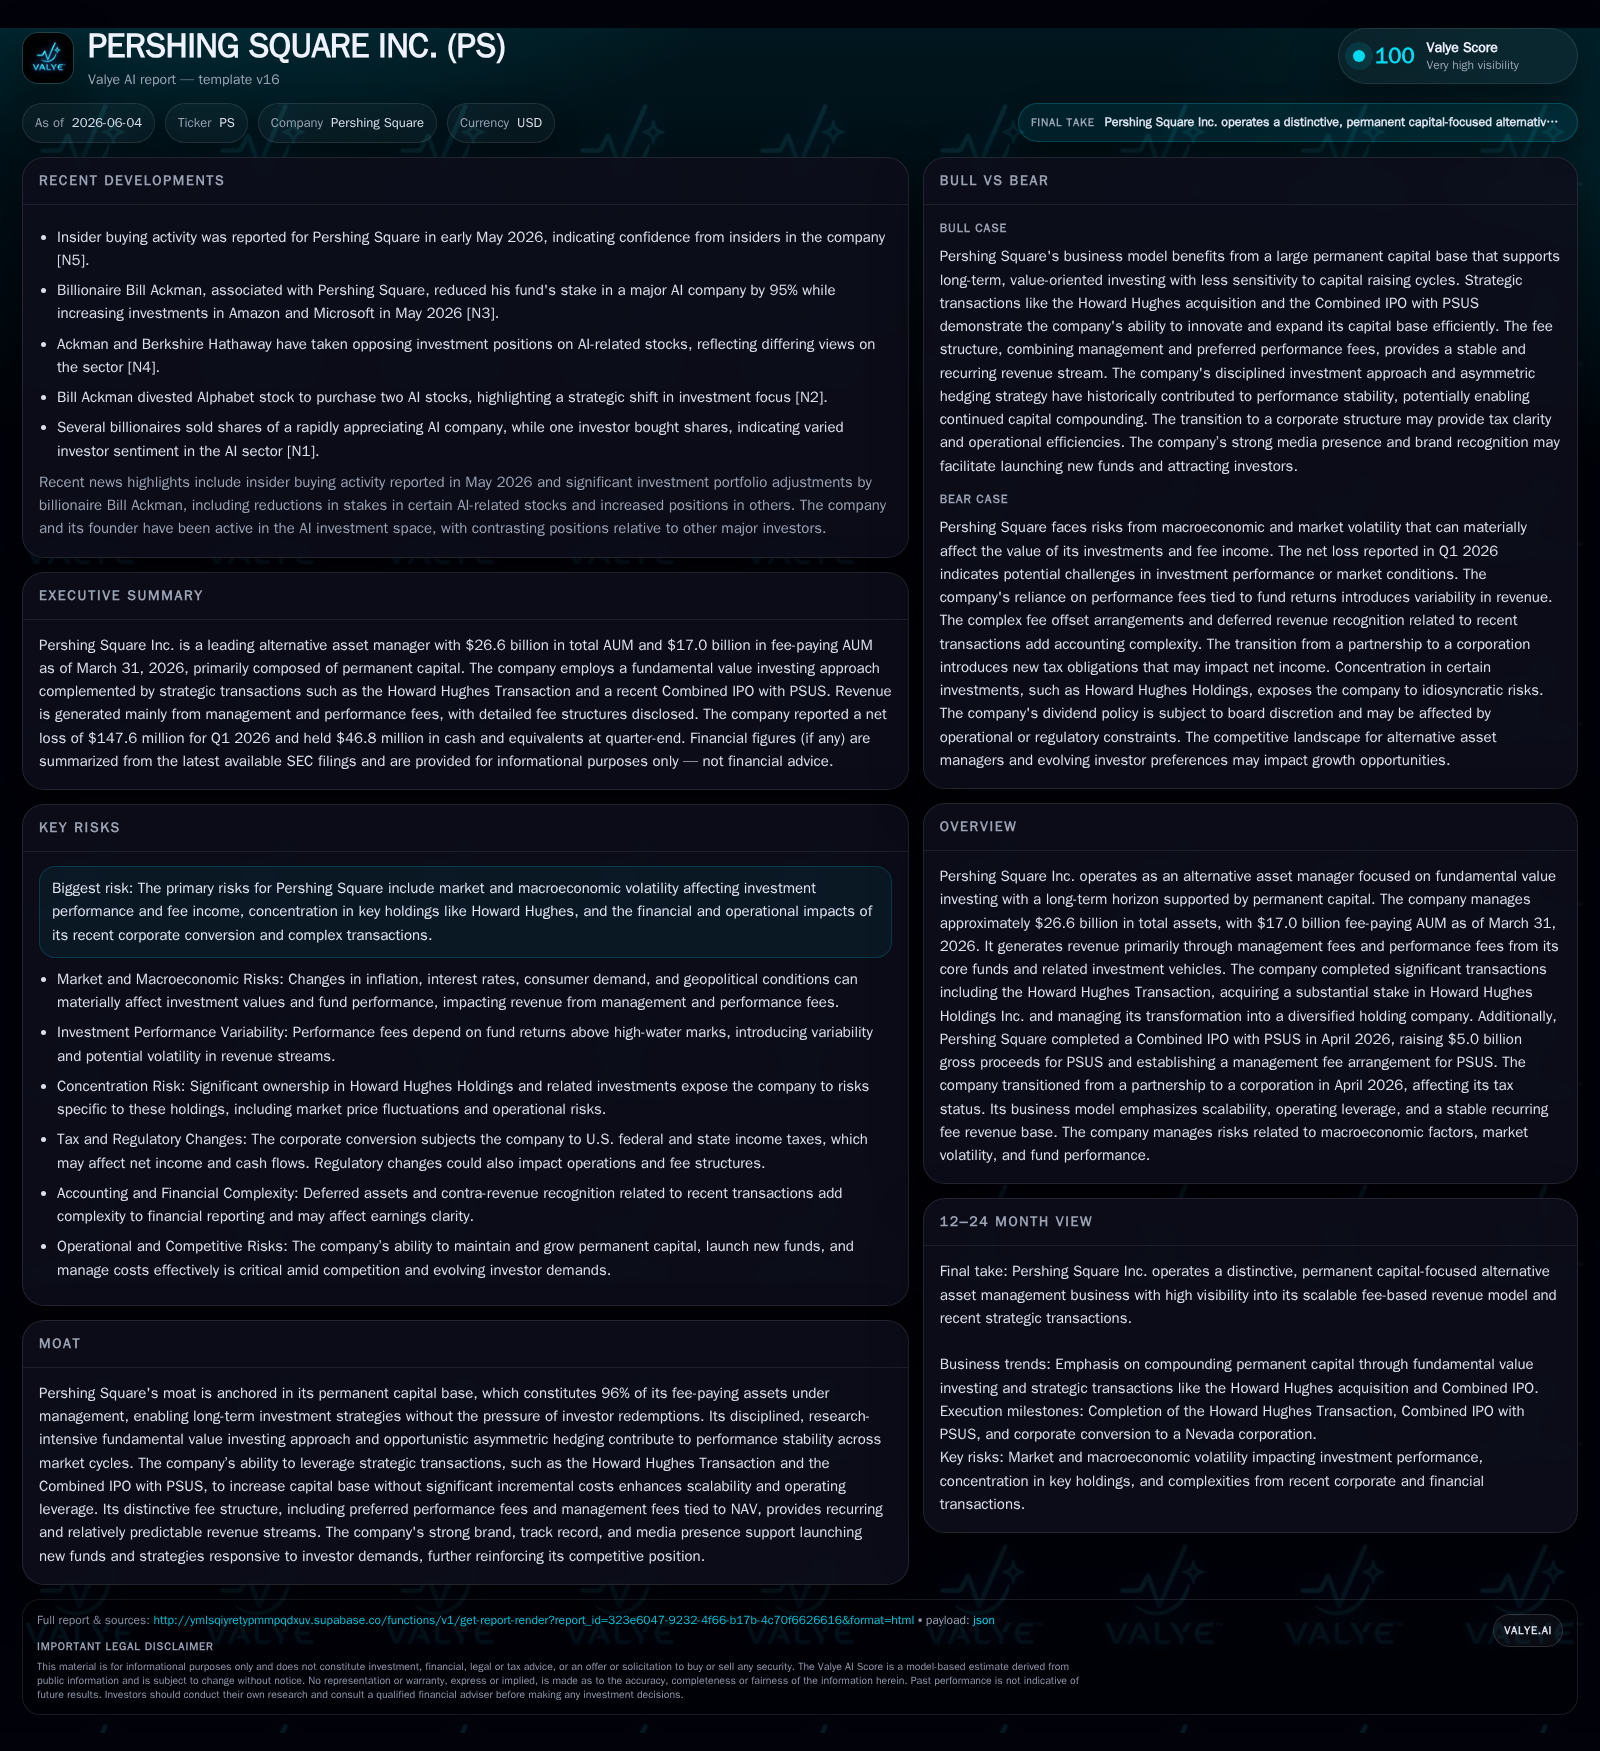
Pershing Square Inc. finalized a transformative corporate conversion combined with a public offering in April 2026, which significantly adjusted its capital base and fee structures. As of March 31, 2026, the firm managed $26.6 billion in AUM with a dominant permanent capital mix of 96%, enhancing fee predictability and stable earnings visibility. The firm’s business model leverages long-duration investments, opportunistic asymmetric hedges, and innovative transactions such as the Howard Hughes acquisition to build scalable, recurring revenue streams. While this structural evolution diversifies fee sources and strengthens liquidity with new debt facilities, risks remain concentrated in key holdings and market volatility influencing performance fees. Near-term focus centers on performance fee realizations and integrating the broader asset base from strategic transactions.
Q1 2026 Operating Update: Post-IPO Dynamics
Pershing Square Inc.’s first fiscal quarter after completing its corporate conversion and Combined IPO with Pershing Square USA Ltd. (PSUS) reveals fundamental shifts in the firm’s operating profile. Total assets under management (AUM) reached approximately $26.6 billion as of March 31, 2026, with $17.0 billion classified as fee-paying assets under management [S2]. Notably, about 96% of these fee-paying AUM represent permanent capital—capital not subject to investor redemption—providing revenue stability uncommon among alternative asset managers
The Combined IPO executed on April 30, 2026 raised gross proceeds of $5 billion for PSUS while Pershing Square Inc.’s corporate conversion transitioned it from a partnership vehicle into a public corporation without raising incremental capital itself [S3]. This restructuring reshapes management fee recognition: fees are now earned based on net asset values (NAV) rather than fundraising inflows, producing more predictable revenues linked to compounded investment returns.
Operational metrics from Q1 show a $497 million decrease in accrued performance fee receivables alongside improved distributable earnings availability [S8]. Cash generated from operations rose to $87.9 million despite a net loss driven primarily by unrealized mark-to-market losses on equity holdings including Howard Hughes Holdings (HHH). Capital distributions totaled roughly $90.6 million during the period.
Business Model Precision: Permanent Capital Fueling Scalable Fee Engines
Pershing Square’s strategy centers on long-duration fundamental value investing supported by a unique permanent capital base that differentiates it structurally from alternative managers reliant on open-ended fund redemptions or finite drawdown cycles [S2]. This structure enables flexible deployment of opportunistic asymmetric hedges designed to limit risk case while capturing upside potential — a niche difficult to replicate at scale by peers dependent on frequent fundraising.
Management fees accrue on NAV rather than solely asset inflows or commitments, establishing stable recurring revenues enhanced by preferred performance fee arrangements tied to NAV growth benchmarks. These arrangements also extend to PSUS which pays quarterly NAV-linked management fees but no incentive fees [S3]. This hybrid model supports operating leverage since large capital infusions or strategic transactions — such as the Howard Hughes Transaction — increase fee-bearing assets without proportional increases in expenses or headcount.
This research-driven approach combined with hedging facilitates compounding permanent capital at attractive rates over time without margin pressure typical for managers facing redemption or fundraising demands.
Competitive Edge: Structural Moat in Alternative Asset Management
Unlike many competitors exposed to investor redemption pressures or finite fund terms requiring repeated capital raises and scaling challenges, Pershing Square benefits from having approximately 96% of its fee-paying AUM as permanent capital [S2]. This creates a competitive moat by granting greater control over investment duration and sizing.
Its unified "one-firm approach" consolidates governance across core funds minimizing resource duplication while unlocking economies of scale rare among alternative managers with segmented fund complexes. Additionally, its asymmetric hedge strategy tends to moderate volatility without sacrificing performance potential — supporting stable distribution even amid market turbulence.
Strategic expansions such as acquiring nearly half ownership in Howard Hughes Holdings—which completed acquisition of specialty insurer Vantage for approximately $2.1 billion—expand the firm's footprint beyond pure investment management into diversified operating company ownership managed without incremental fees [S17]. This blend offers advantages unique among publicly listed hedge fund models.
Capital Structure Transformation and Liquidity Position
Coinciding with these strategic moves was a comprehensive overhaul of Pershing Square’s liquidity framework. Legacy credit lines from 2014 and 2021 were fully repaid and terminated upon closing the Combined Transaction [S4][S5]. They were replaced by a senior secured credit facility composed of a $250 million revolving credit facility plus a $100 million term loan facility maturing April 30, 2029—secured by first-priority liens on substantially all company assets [S28].
At quarter-end March 31, cash and equivalents totaled approximately $46.8 million against total debt outstanding near $34.8 million, resulting in an estimated net cash surplus around $12 million [F1]. Financial covenants require maintaining consolidated leverage ratios below 2.5x ensuring prudent balance sheet management.
This refreshed capital structure enhances flexibility for opportunistic investments like follow-on acquisitions or funding allocations into PSUS alongside cushioning operational expenditures related to integration efforts.
Growth Drivers: Strategic Transactions and Fee Expansion Potential
Growth prospects stem from organic compounding of permanent capital complemented by selective large-scale transactions aligned with core competencies [S2]. The Howard Hughes Transaction exemplifies this approach: acquiring significant ownership enabled transformation into an operating holding company incorporating real estate alongside specialty insurance segments acquired through Vantage [S17]. Such deals expand total managed assets immediately without proportionate increases in operating costs.
Further growth is supported through PSUS’s Combined IPO which raised over $5 billion gross proceeds [S3][S17]. Management fees derived from PSUS are fixed percentages of NAV paid quarterly upfront but exclude incentive fees—adding steady revenues that buffer variable income sources.
Additionally, accretive reinvestments including anchor investments into PSUS shares reinforce alignment while enabling scale efficiencies within platforms optimized around permanent capital [S12].
Risk Factors: Concentration and Market Sensitivity Post-Conversion
Despite structural strengths several risks remain relevant given recent changes [S2]. Market cyclicality still impacts performance fees which crystallize mainly late-in-year; thus income remains sensitive to portfolio valuation fluctuations.
Concentration risk is notable given material stakes such as nearly half ownership in HHH; adverse developments here could disproportionately affect earnings consistency. Transitioning from partnership tax treatment to corporate form introduces complexities potentially affecting distribution policies and accounting for equity interests.
Moreover, new debt covenants impose leverage constraints requiring ongoing compliance monitoring alongside operational integration challenges arising from recent acquisitions.
What to Watch Next: Performance Metrics and Transaction Integration Milestones
Key near-term indicators include tracking timing and magnitude of deferred performance fee receivables which declined substantially in Q1 but typically realize post-year-end calendar closings [S8][S23]
Integration progress within Howard Hughes Holdings—particularly consolidation of Vantage operations without incremental fees—will be critical for sustaining margins.
Monitoring deployment of PSUS proceeds beyond initial raise along with adherence to financial covenants under new credit facilities will clarify balance sheet resilience amid evolving market conditions.
Regulatory or governance changes related to corporate form conversion also warrant observation given their potential influence on dividend policy adjustments.
Summative Financial Context: Cash Flows, Leverage, and Distributions
Financially, Pershing Square reported a net loss near -$147.6 million for Q1 primarily due to unrealized equity write-downs including HHH but generated strong positive operating cash flow totaling approximately $87.9 million indicative of underlying economic profitability excluding non-cash markdowns [F1][S8]
Fee-related earnings reached about $130.7 million reflecting recurring revenues net direct compensation costs supporting healthy margins around 80% [S8]. Capital distributions paid amounted to roughly $90.6 million consistent with disclosed distributable earnings frameworks
Balance sheet positioning is conservative post-refinancing showing net cash rather than traditional net leverage providing financial flexibility essential for continued transaction-driven growth initiatives [F1][S4][S25]
Disclaimer: This analysis is based exclusively on publicly available information as cited and does not constitute investment advice or research views.
Financial position in context
As of 2026-03-31, companyfacts shows $47mm in cash and equivalents and $35mm of total debt [F1]. The same snapshot implies net debt of roughly $-12mm, keeping balance-sheet context relevant but secondary to the operating story [F1].
Disclaimer: This is research-only, informational analysis and not investment advice. It may include AI-generated interpretation and general industry context. Always verify important details using primary sources.
Comments