
Polestar Automotive: Growth Ambitions Collide with Capital Strain
Polestar pursues premium electric vehicle expansion amid widening losses and liquidity challenges.
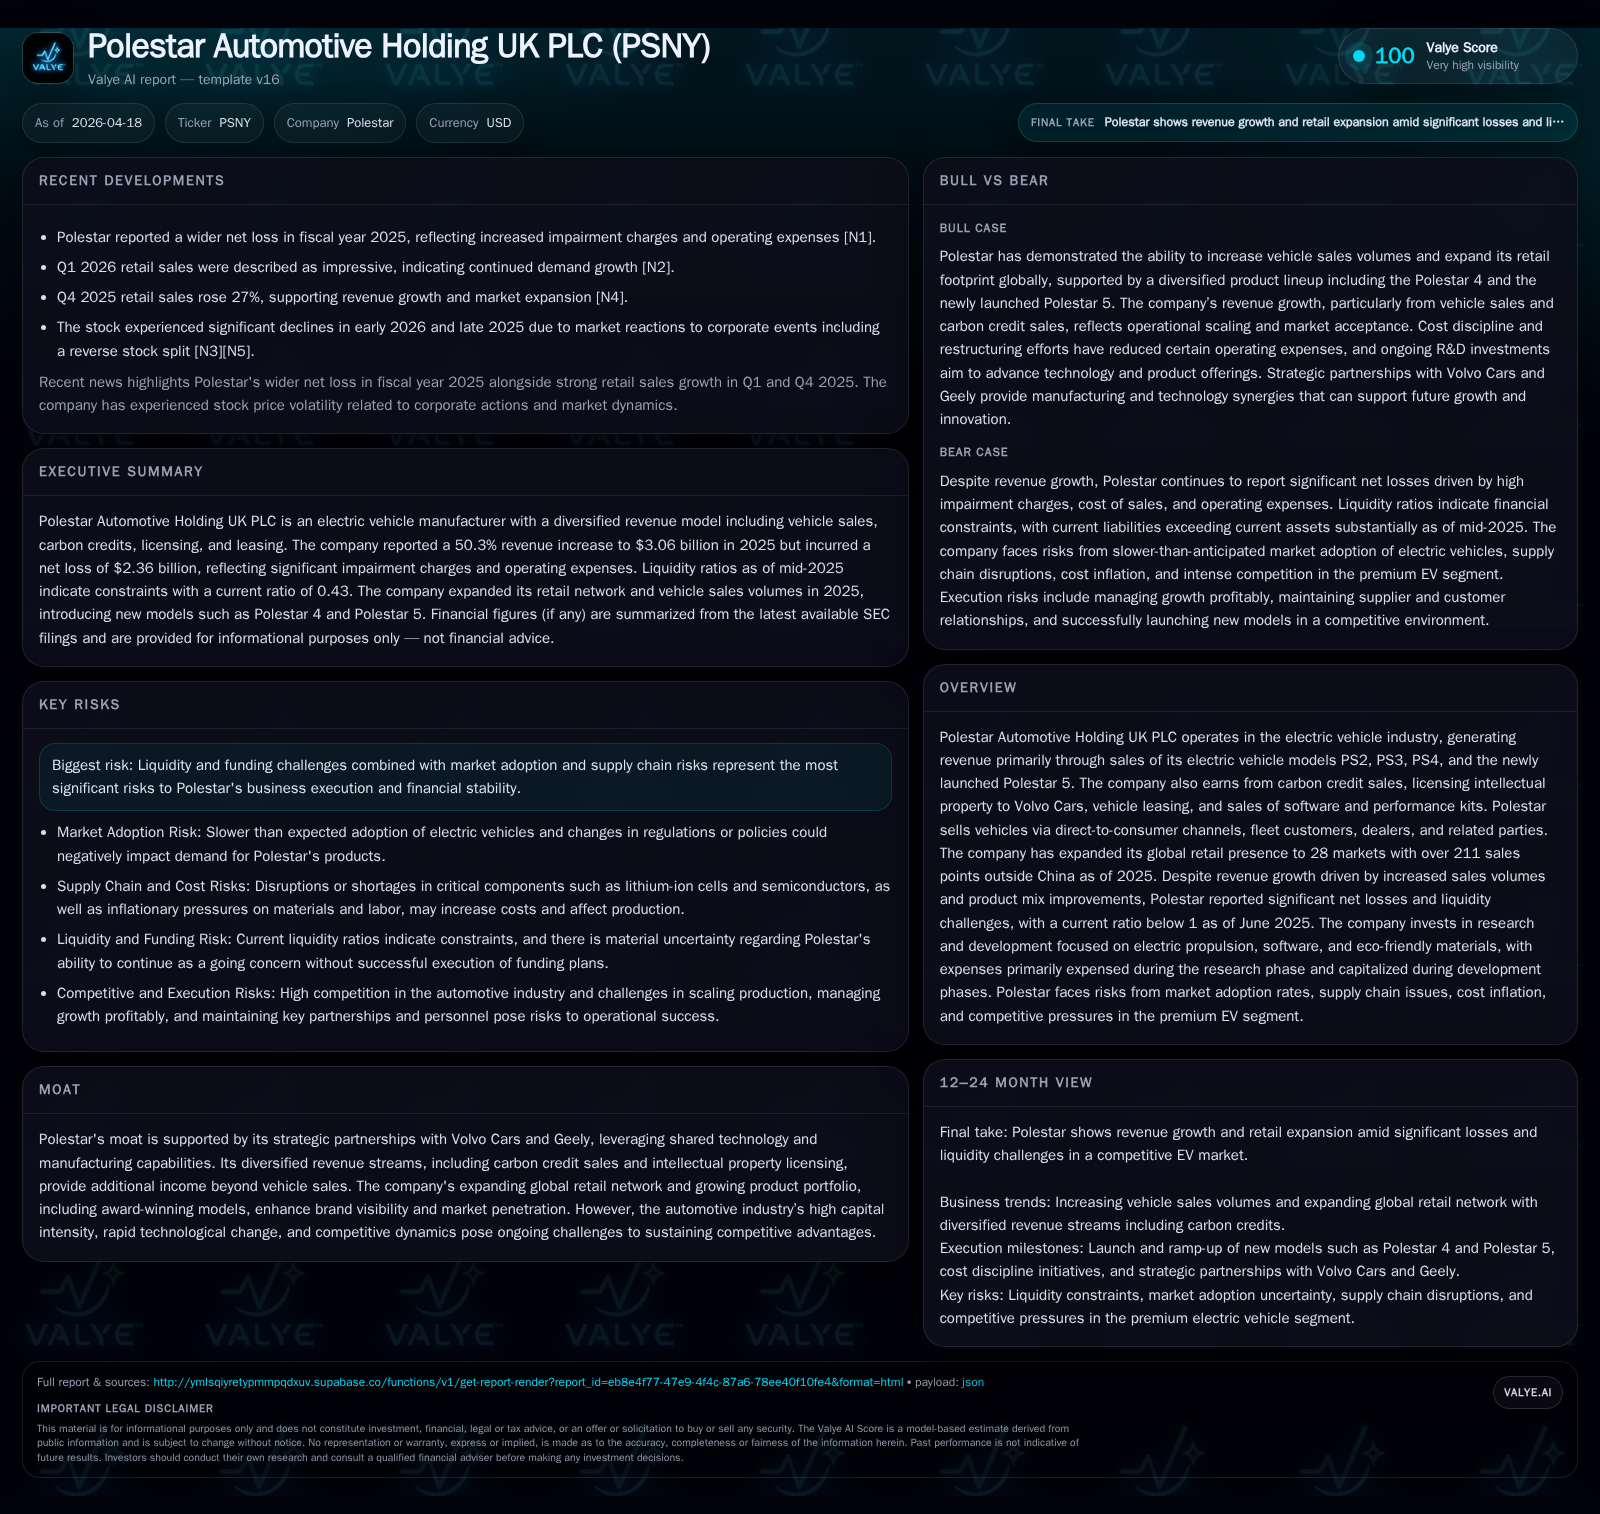
Polestar Automotive Holding UK PLC, a pure play premium electric vehicle manufacturer, posted a 34% increase in retail sales volumes in 2025 despite a 14% revenue decline from 2023 to 2024. Multiple revenue streams including carbon credit sales and IP licensing support its top line. However, net losses widened sharply to nearly $2.05 billion in FY2024, deepening negative equity and straining liquidity with a current ratio of 0.43 as of mid-2025. Leadership experience and strategic partnerships underpin growth potential, while regional market dynamics and operational scaling remain critical to future performance.
From High-Speed Sales Growth to Mounting Losses: Polestar’s Recent Performance
Polestar Automotive Holding UK PLC reported approximately 34% year-over-year growth in retail vehicle sales volumes in the calendar year ended December 31, 2025, driven by an attractive product lineup including models PS2 through PS4 alongside the recent Polestar 5 launch [N2][S1]. Despite this volume growth, reported revenue declined about 14% from approximately $2.37 billion in FY2023 to $2.03 billion in FY2024 [F1], reflecting margin pressures from rising manufacturing costs and evolving product mix.
Net losses widened substantially by roughly 73%, increasing from about -$1.18 billion in FY2023 to nearly -$2.05 billion in FY2024 [F1][N1]. This deterioration contributed to shareholders’ equity plunging into deep negative territory at -$3.33 billion by year-end FY2024 compared to -$1.25 billion the prior year [F1], underscoring accumulated deficits beyond typical capital intensity.
Historical performance (annual)
| FY | Rev ($bn) | Net ($bn) | Rev YoY | Net YoY |
|---|---|---|---|---|
| 2024 | 2.0 | -2.0 | -14.1% | -73.4% |
| 2023 | 2.4 | -1.2 | -3.8% | -153.7% |
| 2022 | 2.5 | -0.5 |
Source: SEC companyfacts cache [F1].
Capital returns and efficiency (annual)
| FY | ROE% |
|---|---|
| 2024 | 61.6 |
| 2023 | 94.5 |
| 2022 | 348.5 |
Source: SEC companyfacts cache [F1].
Diversified Revenue Streams Beyond Vehicles Bolster Top Line
Beyond core vehicle sales spanning direct-to-consumer channels, fleet customers, dealers, and related parties such as Volvo Cars [S1], Polestar generates revenues from multiple ancillary sources:
- Regulatory carbon credit sales capitalize on emissions compliance markets.
- Intellectual property licensing related to software upgrades and performance kits for Volvo Cars vehicles provides recurring income streams.
- Vehicle leasing operations contribute operating lease revenues aligned with mobility-as-a-service trends.
- Additional income arises from R&D collaborations and licensing of parts/accessories.
This diversified approach supports top-line resilience amid cyclical automotive industry dynamics [S1].
Liquidity Constraints Amid Capital-Intensive Growth
As of June 30, 2025, Polestar held cash and equivalents totaling approximately $719 million against current liabilities exceeding $5.20 billion resulting in a low current ratio near 0.43 [F1]. This indicates significant short-term liquidity risk given working capital demands inherent in automotive production cycles including contract manufacturing costs and depreciation of right-of-use assets.
The substantial net losses have inflated balance sheet deficits reflected by negative equity of about -$3.33 billion at fiscal year-end FY2024 [F1]. Traditional return-on-equity metrics are less meaningful due to negative equity but highlight capital structure fragility.
Capital-intensive R&D expenditures focus on advancing electric propulsion technologies, software platforms, and eco-friendly materials without immediate capitalization benefits [S1]. Effective conversion of these investments into scalable assets is critical to mitigate cash burn.
Leadership Experience and Strategic Partnerships
Michael Lohscheller assumed CEO duties in October 2024 bringing over two decades of executive experience across Nikola Corporation, Vinfast, Stellantis/Opel, Volkswagen Group, and DaimlerChrysler [S1]. CFO Jean-François Mady contributes extensive financial transformation expertise from Stellantis operations.
Strategic partnerships with Volvo Cars and Geely enable access to shared manufacturing infrastructure and proprietary EV technologies enhancing competitive positioning through economies of scale vital for premium BEV production cost management [S1]. The board includes seasoned automotive industry professionals supporting governance amid execution risks.
Geographic Sales Mix and Market Dynamics
Europe represented roughly 78% of Polestar's sales volume in FY2025 with estimated growth near +55% year-over-year fueled by favorable EU emissions mandates encouraging BEV adoption [S1]. The U.S., comprising about 7% of volume, faced headwinds from federal tax credit expiration post-September 2025 amid an overall EV market contraction estimated at -4% [S1][N2]. Asia-Pacific regions accounted for about 15% of sales supported by subsidy programs; China’s electric passenger vehicle market grew approximately +17%, reaching nearly 13 million units sold in calendar year '25 [S1].
Tariff uncertainties present additional downside risks impacting import duties and supply chain logistics for contract manufacturing-dependent brands like Polestar [S1].
Growth Outlook: Product Pipeline and Market Expansion
Polestar’s growth strategy emphasizes continued rollout across PS2 through PS4 platforms alongside momentum behind the recently launched Polestar 5 sedan which integrates sustainable design innovations including recycled materials [S1][N3].
The company operates physical retail presence across twenty-eight countries with over two hundred eleven retail locations outside China signaling aggressive global expansion aimed at enhancing brand visibility and direct-to-consumer distribution efficiency.
Incremental margin improvement is anticipated through optimized product mix and scaled operational efficiencies; however achieving consistent manufacturing scale remains challenging given ramp-up complexities typical for premium BEVs produced via new or partner-owned facilities [S1][N3].
Capital Allocation: Cash Position and R&D Investments
Cash & equivalents stood near $719 million as of mid-2025 against substantial current liabilities exceeding $5 billion underscoring funding gaps requiring vigilant liquidity management within a capital-intensive context [F1].
Operating cash flow details are limited; however significant ongoing R&D investments targeting propulsion systems advancement, user-centric software ecosystems, and sustainable material development indicate prioritization of long-term strategic positioning despite short-term cash consumption [S1].
Absent positive free cash flow conversion under current conditions may necessitate refinancing or equity raises to bridge funding requirements.
Risks: Supply Chain Volatility, Incentive Dependencies & Competition
Key risks include global supply chain disruptions such as semiconductor shortages potentially delaying production schedules; reliance on government incentives particularly regulatory carbon credit valuations and consumer subsidies which recently expired in the U.S.; tariff impacts on international trade flows; plus intense competition from Tesla alongside traditional OEMs accelerating electrification efforts placing pressure on pricing power margins vital for emerging players like Polestar [S1].
Robust after-sales service infrastructure is important for sustaining premium customer satisfaction affecting repurchase rates and long-term unit economics.
Performance Indicators: Monitoring Volume Trends & Financial Health
Due to limited consensus forecasts given Polestar's recent public company status beyond FY24 filings, investors should monitor quarterly volume announcements expected throughout calendar year ‘26 for directional insight on retail delivery momentum or emerging challenges [N3][S3][S2].
Margin trajectory tied to product mix improvements combined with fixed cost leverage will be key profitability indicators.
Capital structure evolution reflected through working capital metrics changes or deleveraging actions such as equity injections or refinancing will be critical for stabilizing balance sheet conditions currently marked by large negative equity.
Disclaimer: This is research-only, informational analysis and not investment advice. It may include AI-generated interpretation and general industry context. Always verify important details using primary sources.
Comments